Viewing the Time Tracking Details in Apps
You can view the Estimated time and Task progress details in the application.
This information is found in the following three areas.
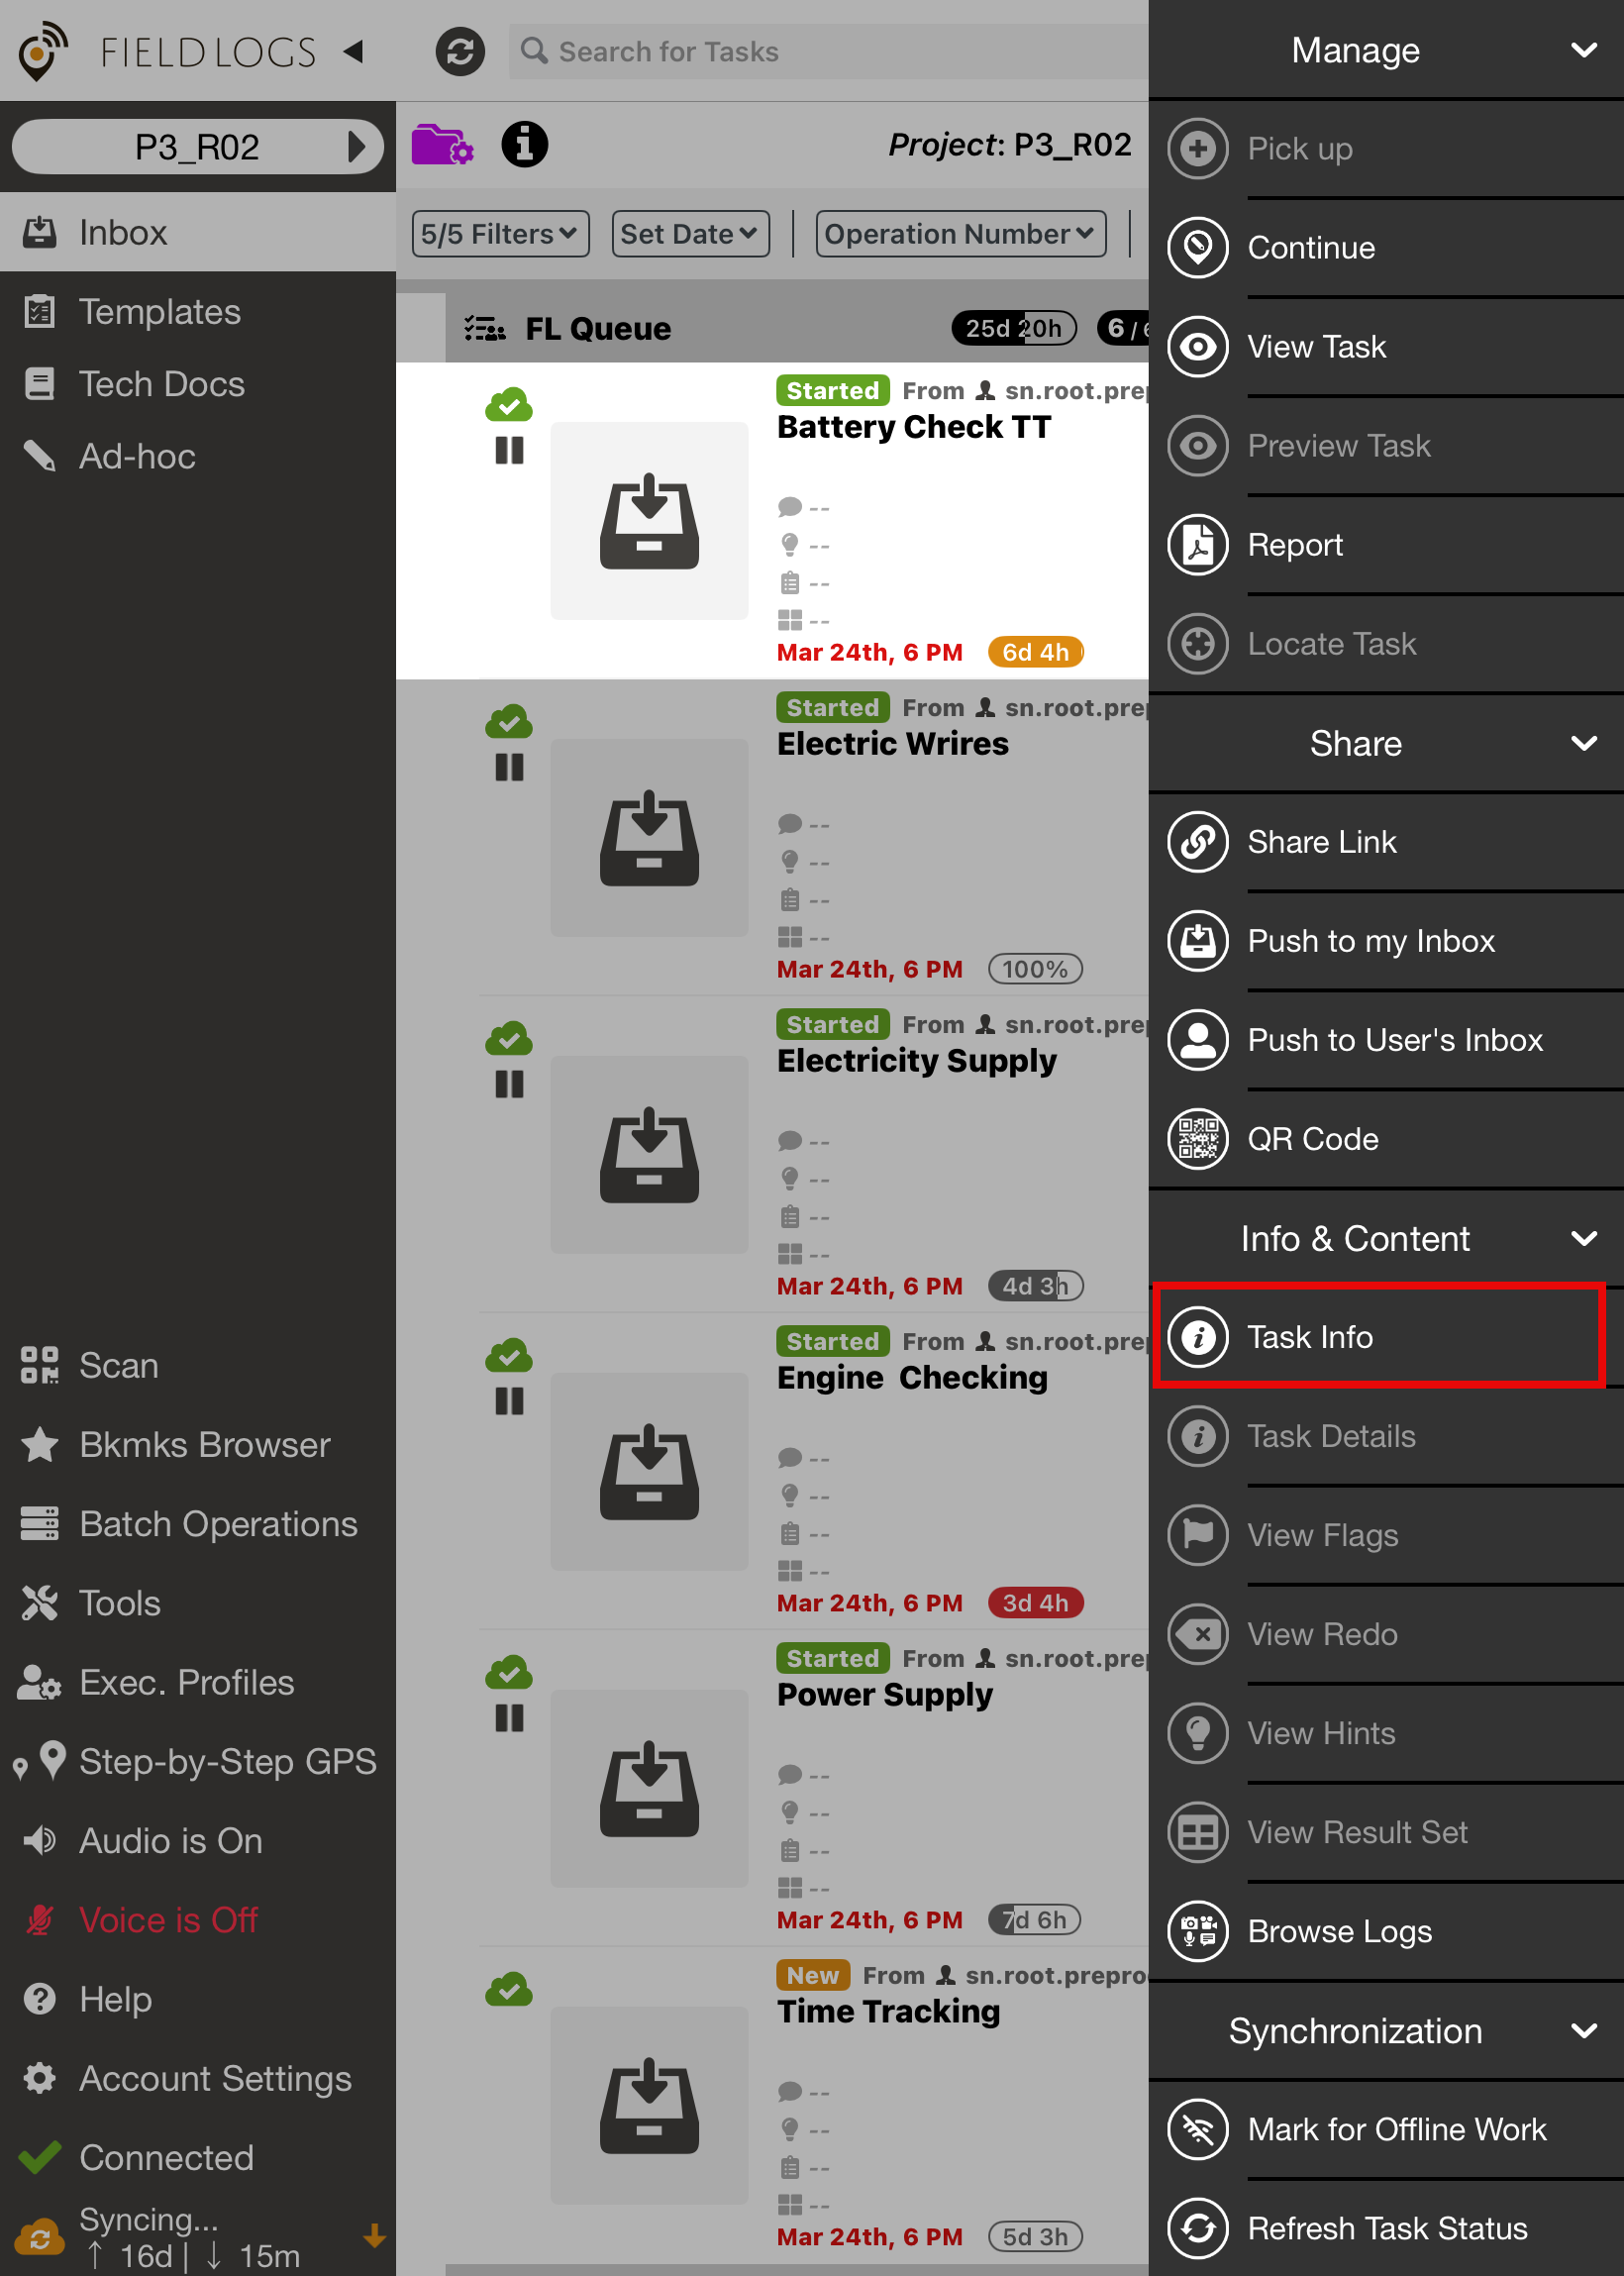
Task Cell
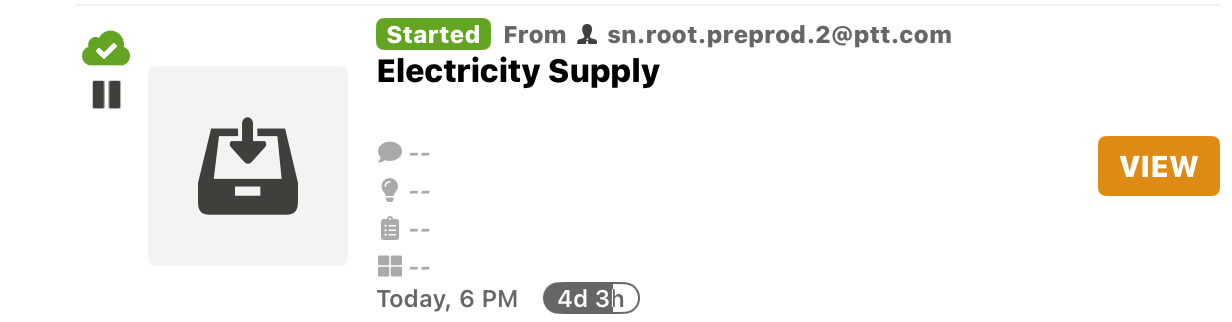
Task Header

Task Information
Task progress is displayed as outlined below:
The Estimated Time is defined during Template creation and shown in a white bubble
 .
.The bubble fills from left to right in grey
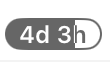 , This indicates the time spent on the Task so far.
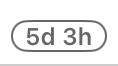
The bubble changes to orange
 when the time spent on the Task is more than 75%.
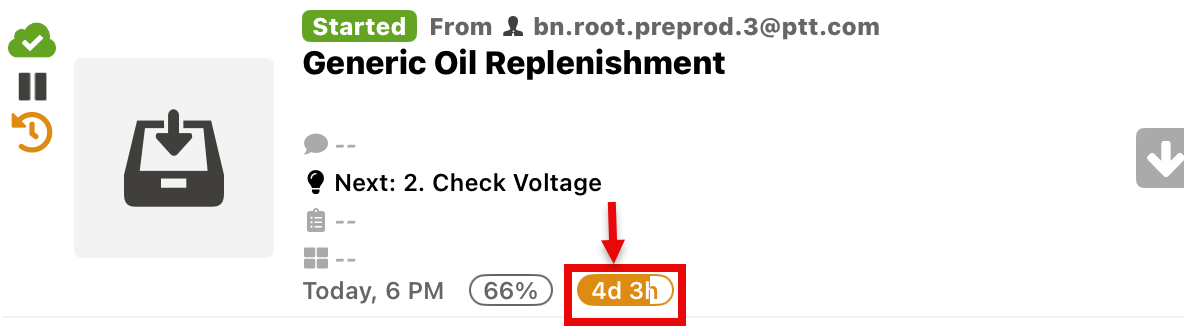
The bubble changes to red
 when the time spent on Task has exceeded the plan duration.
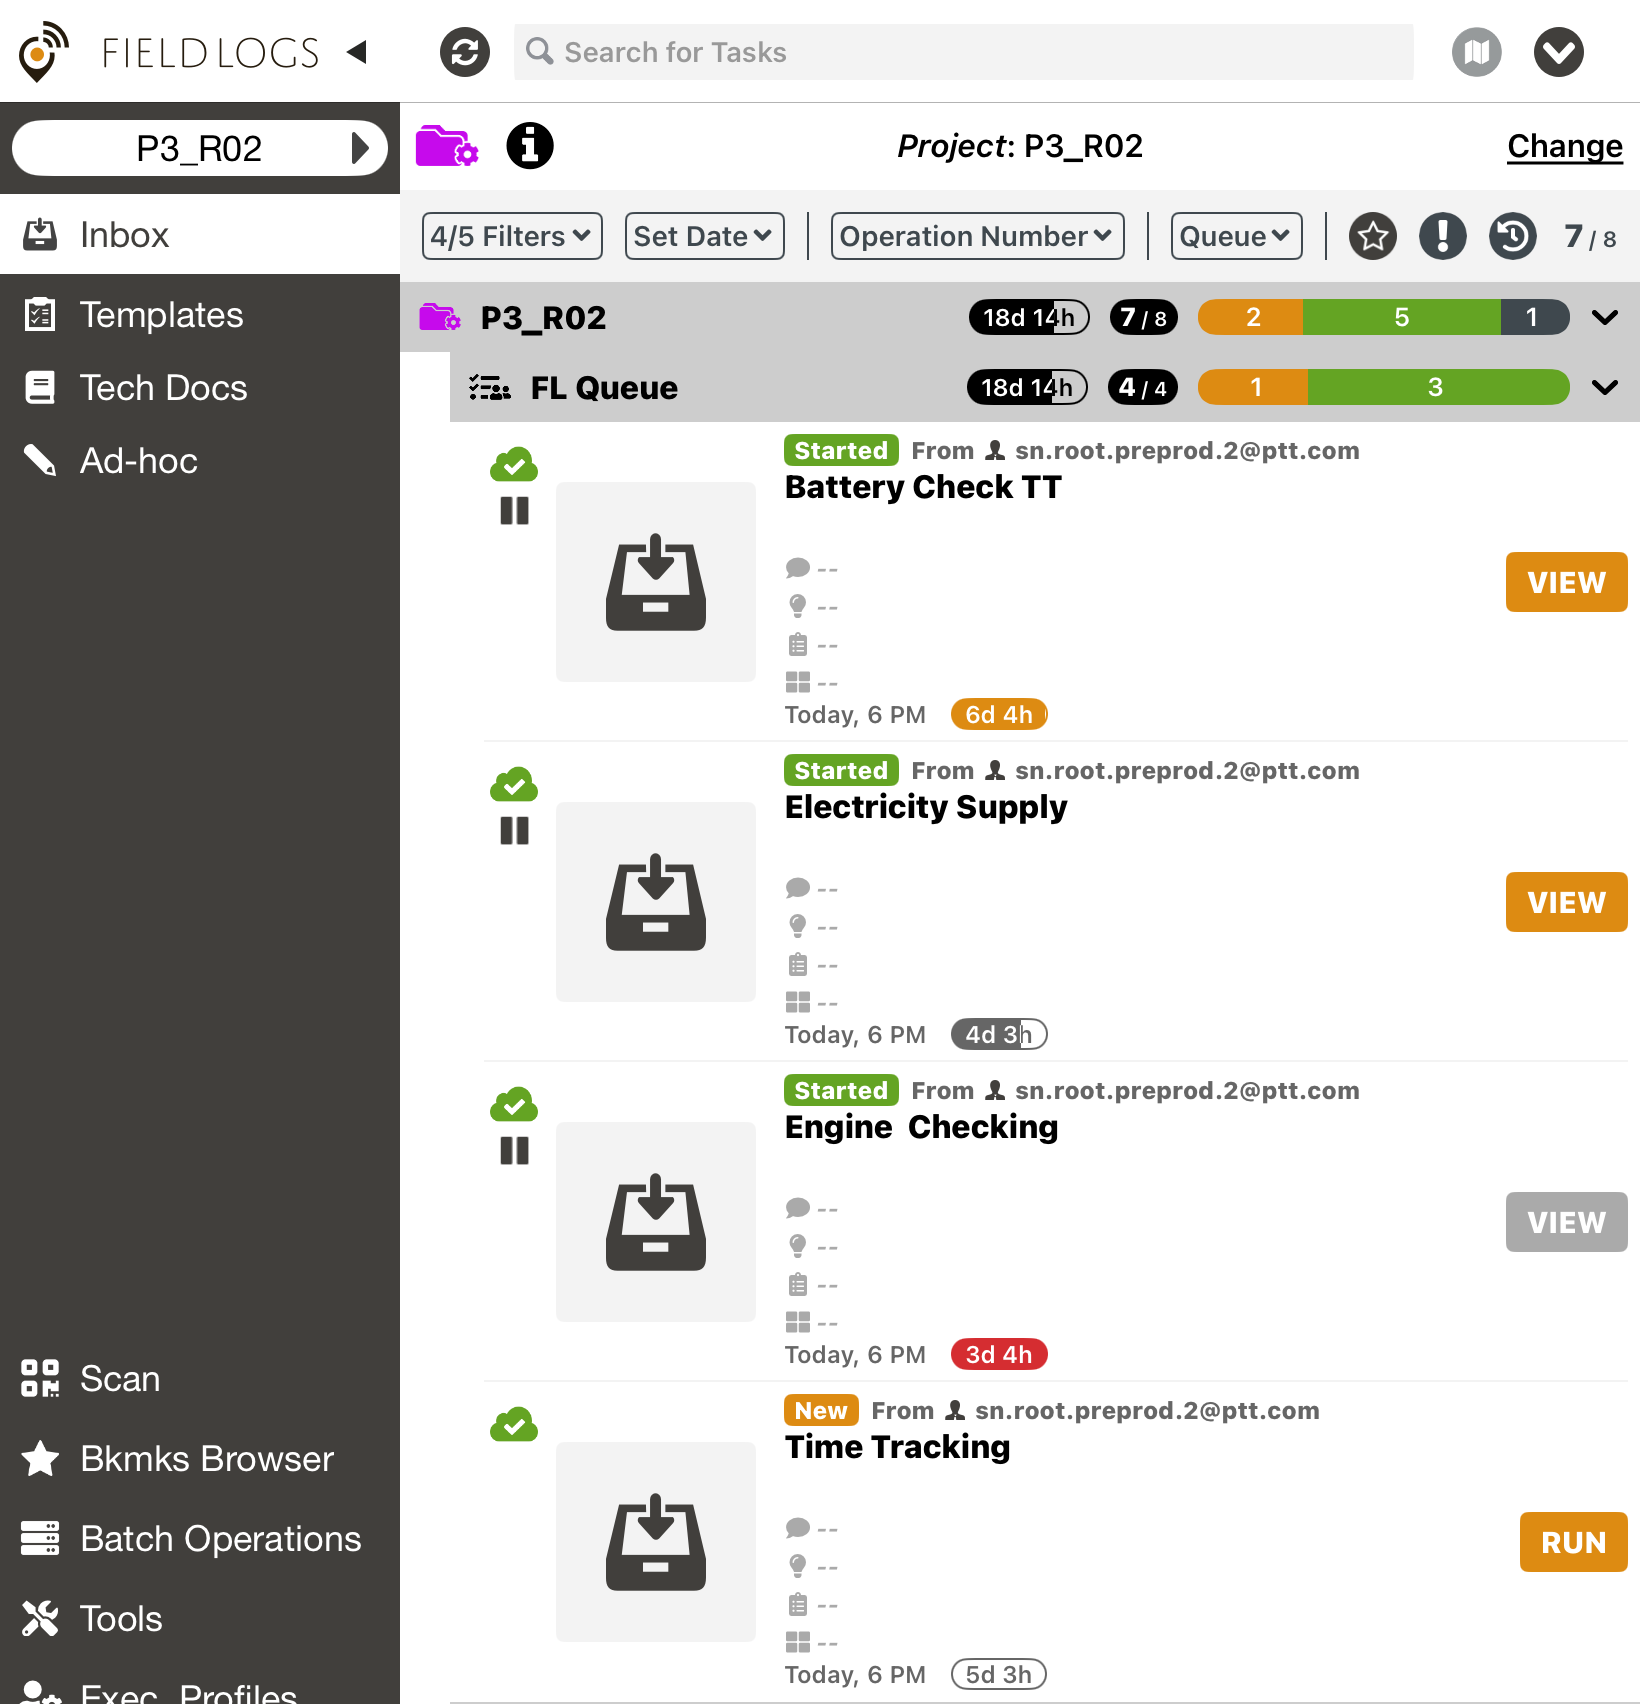
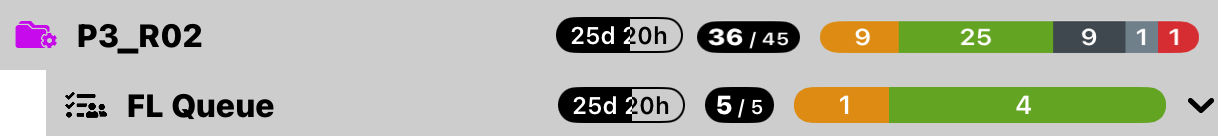
The Section header and Project header indicate the total time spent on all the Tasks.
In the example below, 25d... is the total time spent on all the four Tasks.
 |
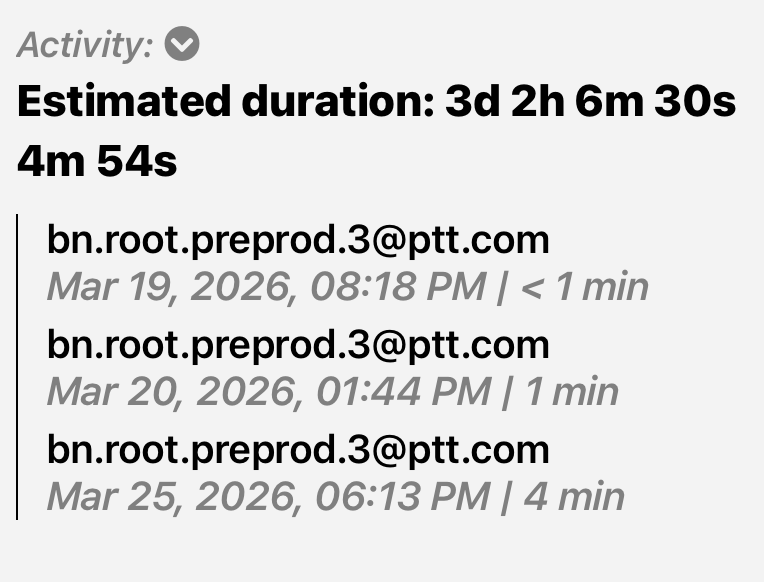
Tapping the progress bubble displays a detailed summary showing the Task’s completion percentage, the Estimated duration, the total time tracked, and the most recent activity entry.
 |
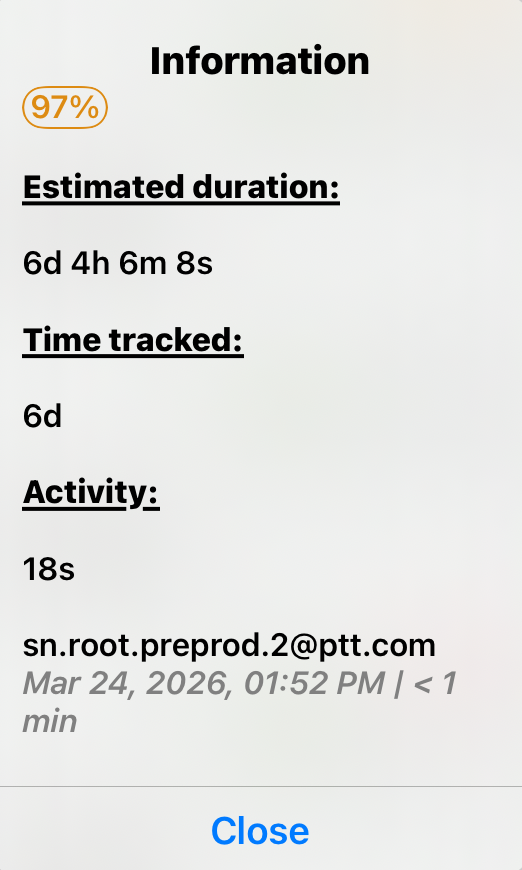 |
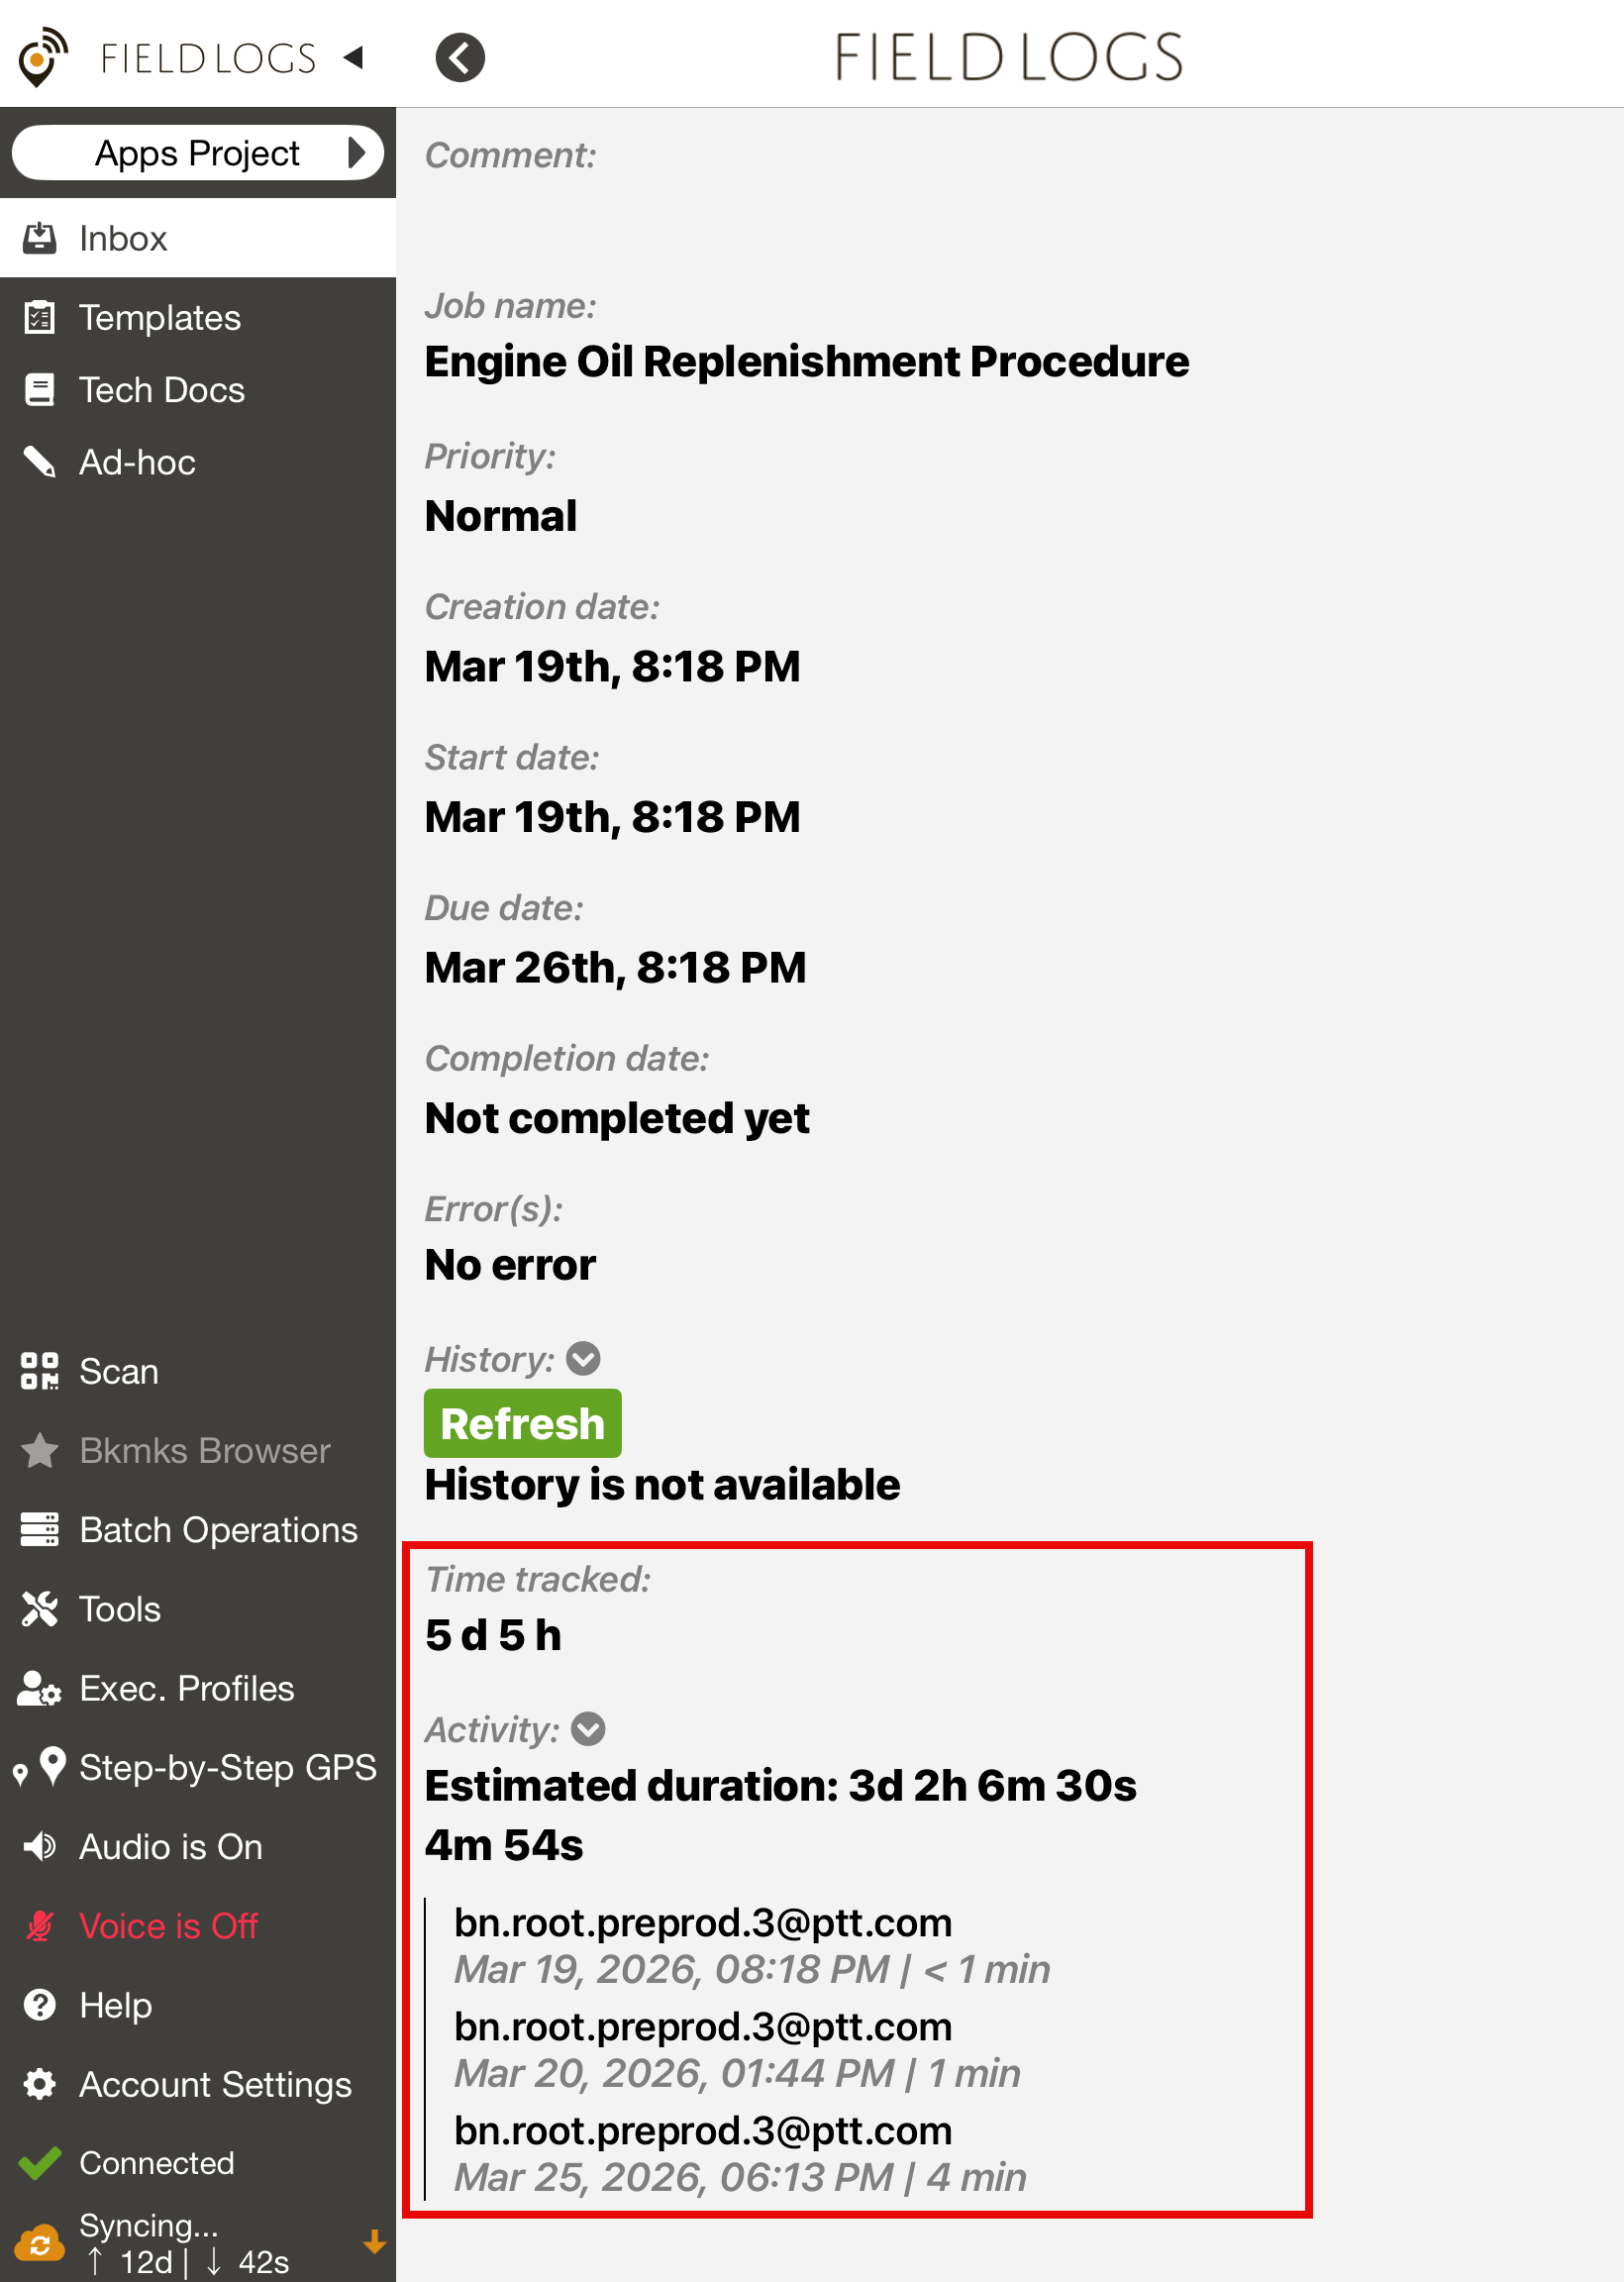
The Task information screen provides a detailed overview of the time tracked.
 |
 |