Accessing the Business Intelligence Dashboard
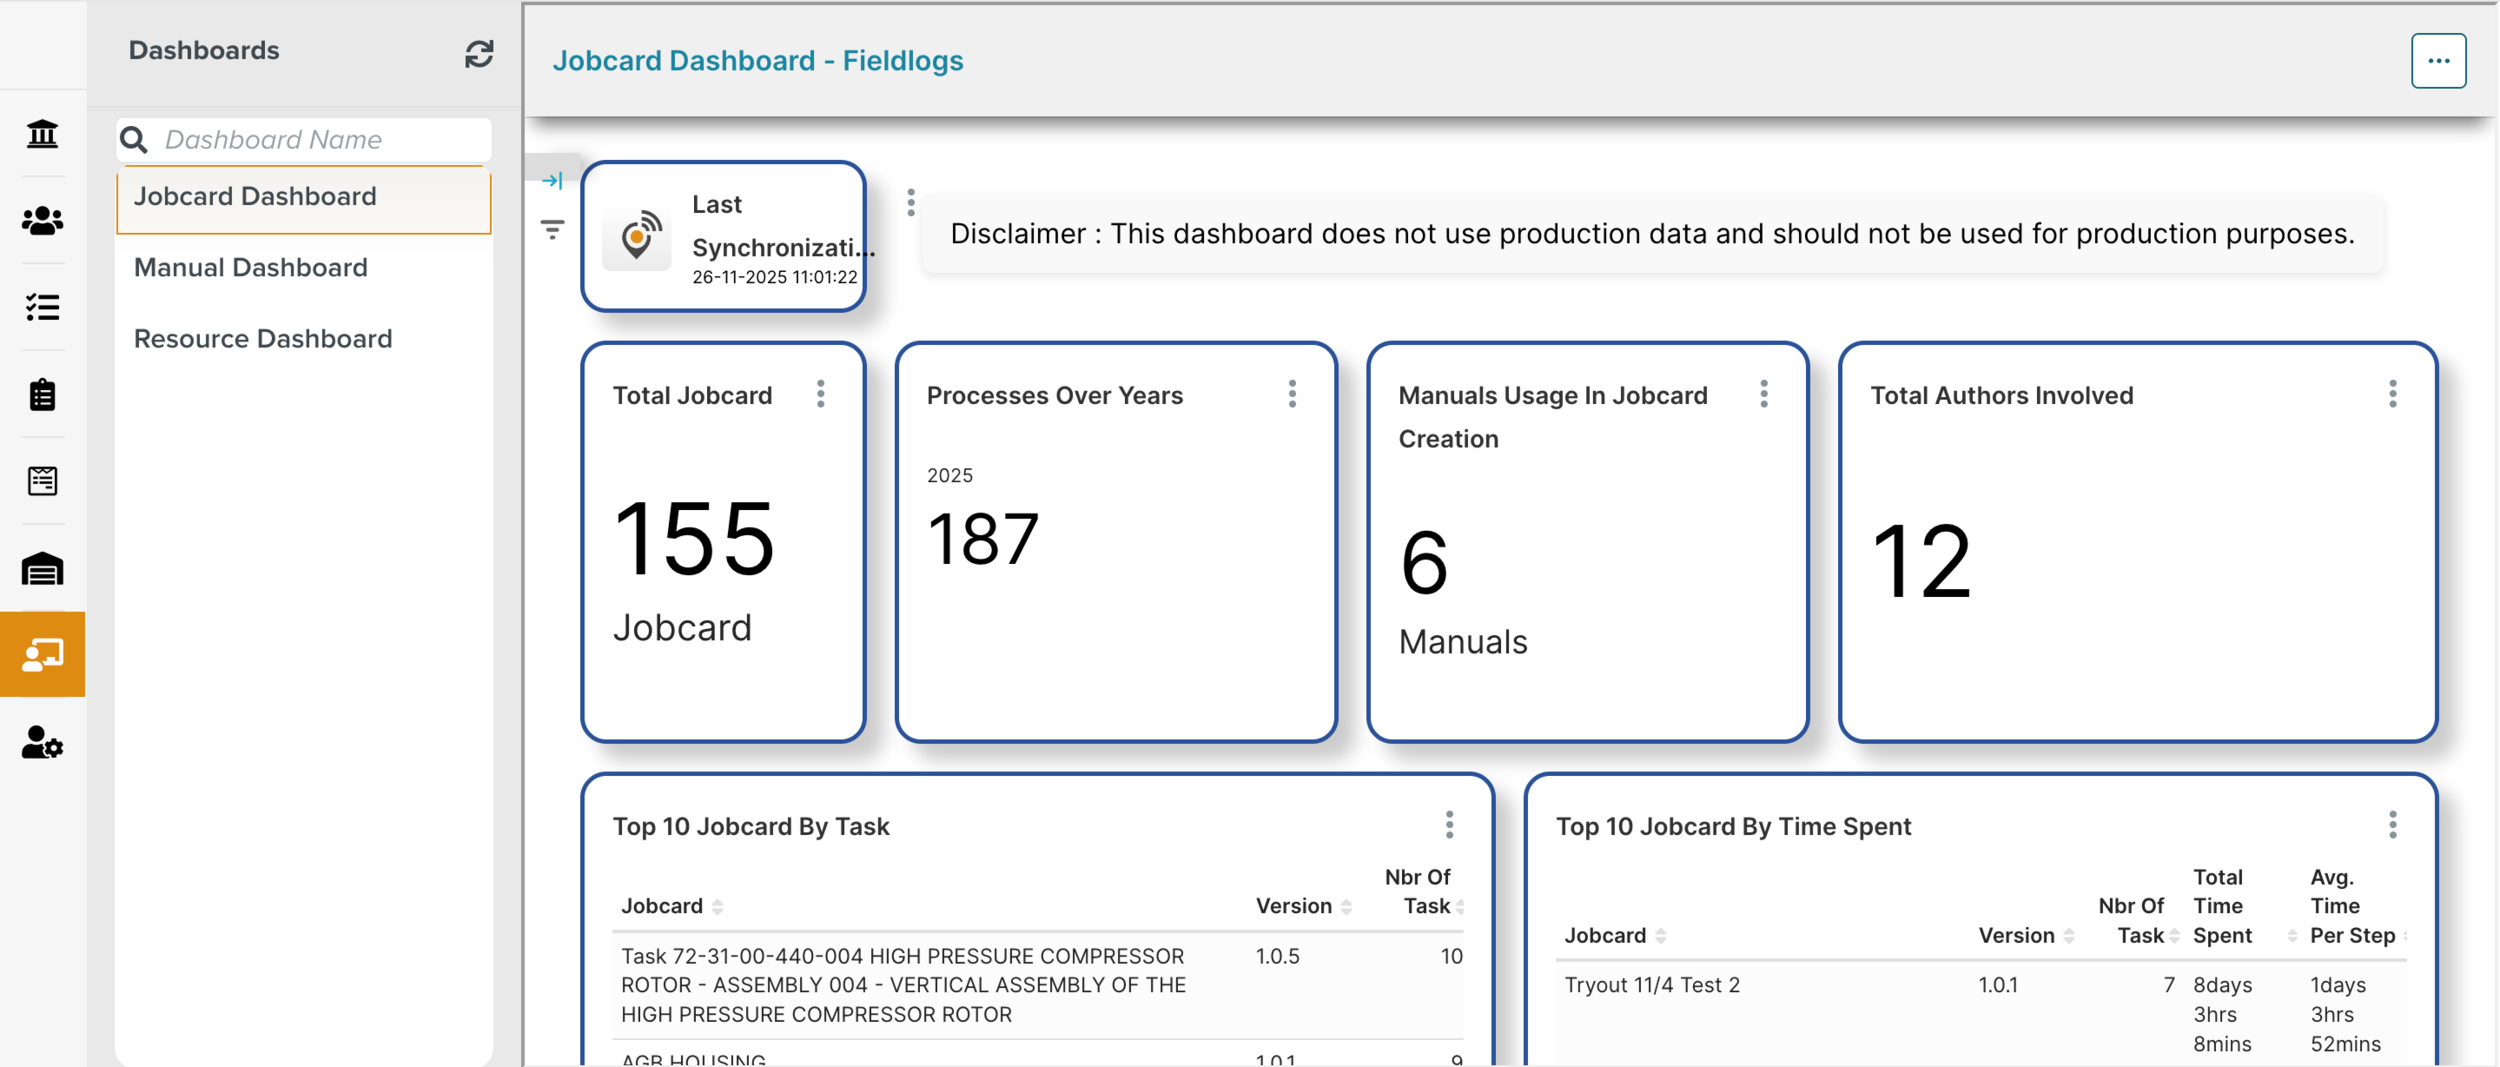
FieldLogs allows you to integrate Business Intelligence (BI) Dashboards for enterprise data monitoring and analysis. It enables visualization of data using charts, graphs, and Key Performance Indicators (KPIs). You can filter or sort the data and interpret metrics.
The BI Dashboards can be configured to reflect your organization’s specific requirements and data needs.
Note
You can enable the pages pertaining to BI Dashboards using the Enterprise Settings BI Data dashboard.
From the main menu, navigate to > . In the Enterprise Hierarchy section go to Settings > Edit (Displayed on a Setting) > Profile > BI Data dashboard and select Yes.
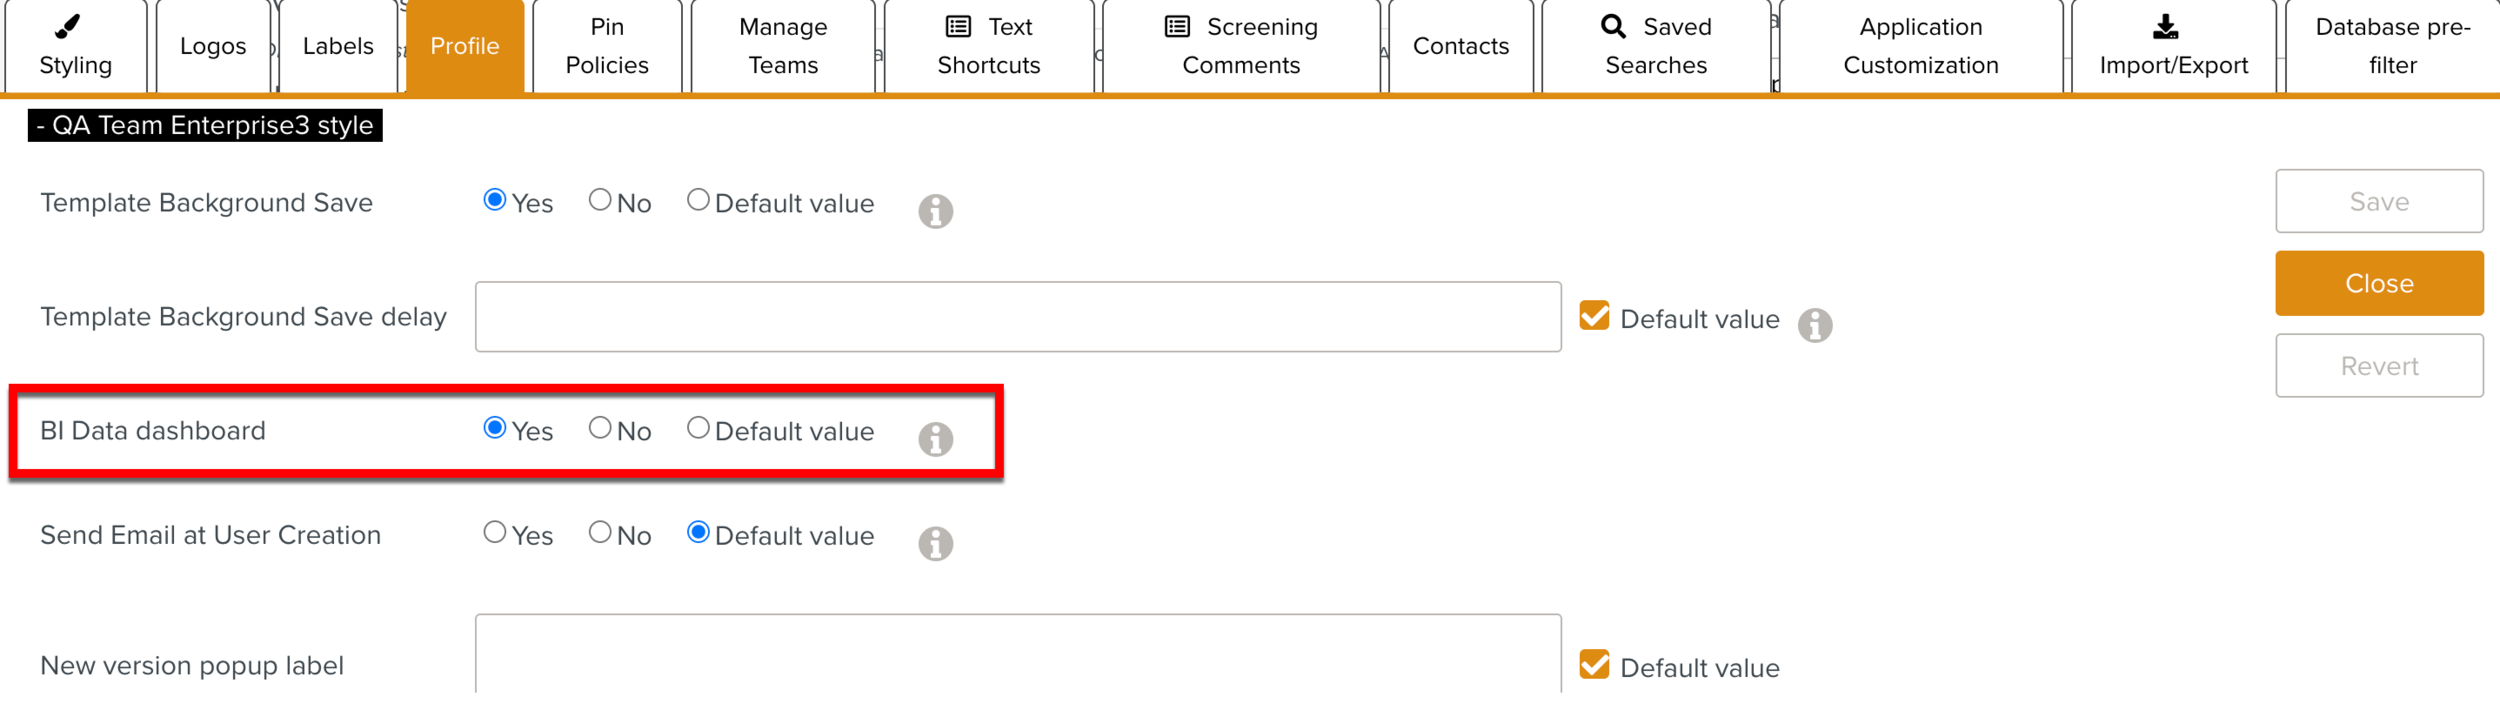
The default value is No.
The BI Dashboards are integrated to FieldLogs using the Resource Manager. Here, you can manage the activation and suspension of the integrated BI Dashboards.
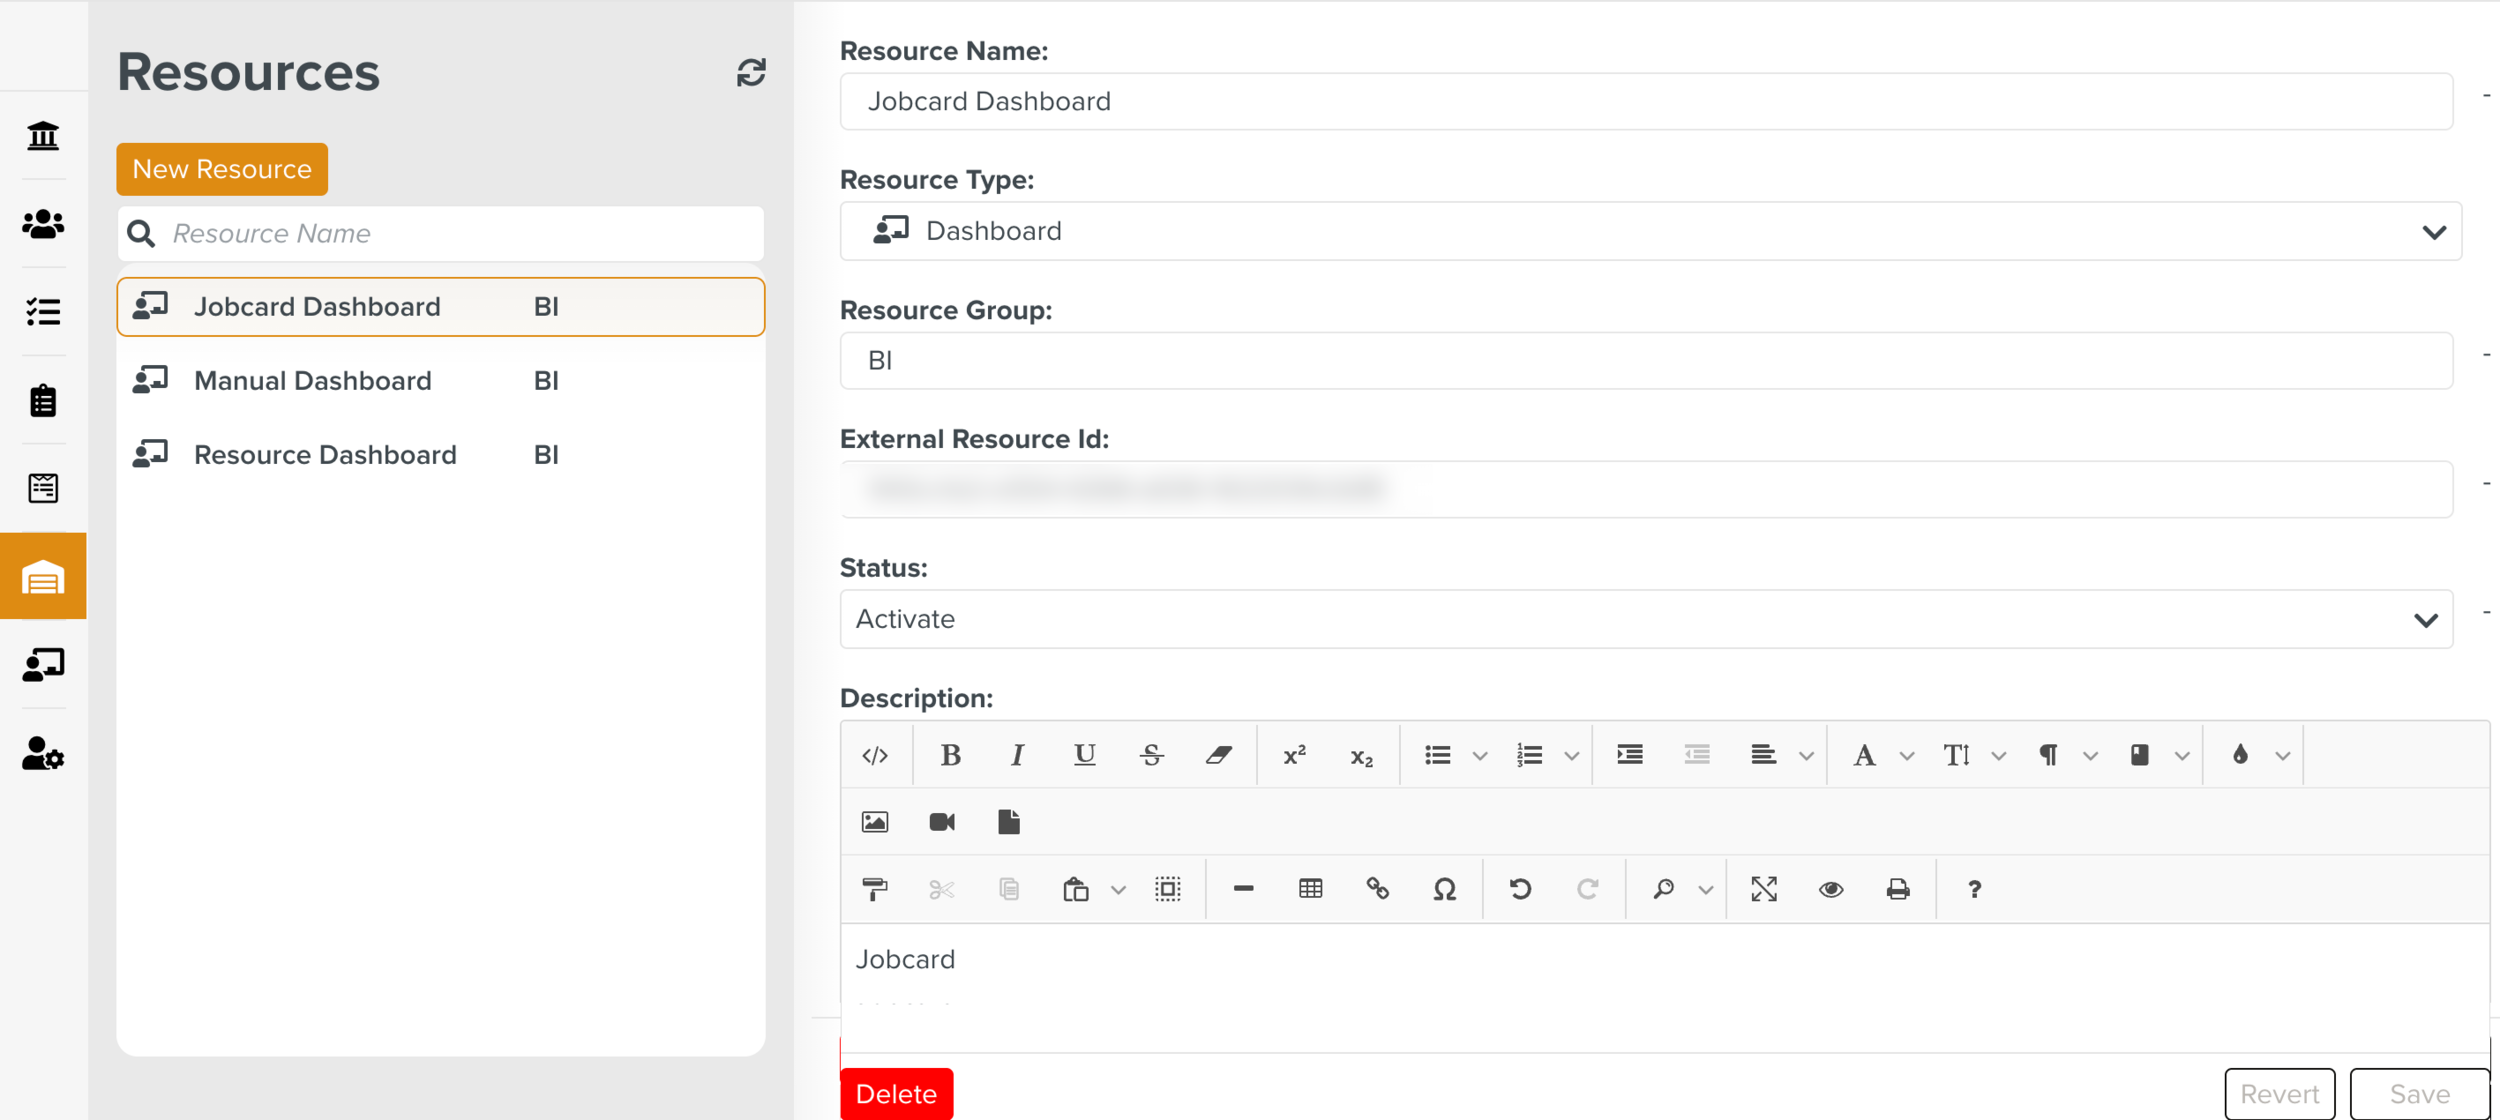 |
When the Resource is activated, you can start using the Dashboards. The Data Dashboard section lists all the integrated Dashboards where you can perform the required actions.
 |