Using the Dashboard
The Dashboards are designed to provide data along with visual or graphical representation on various components such as Templates, Manuals, etc.
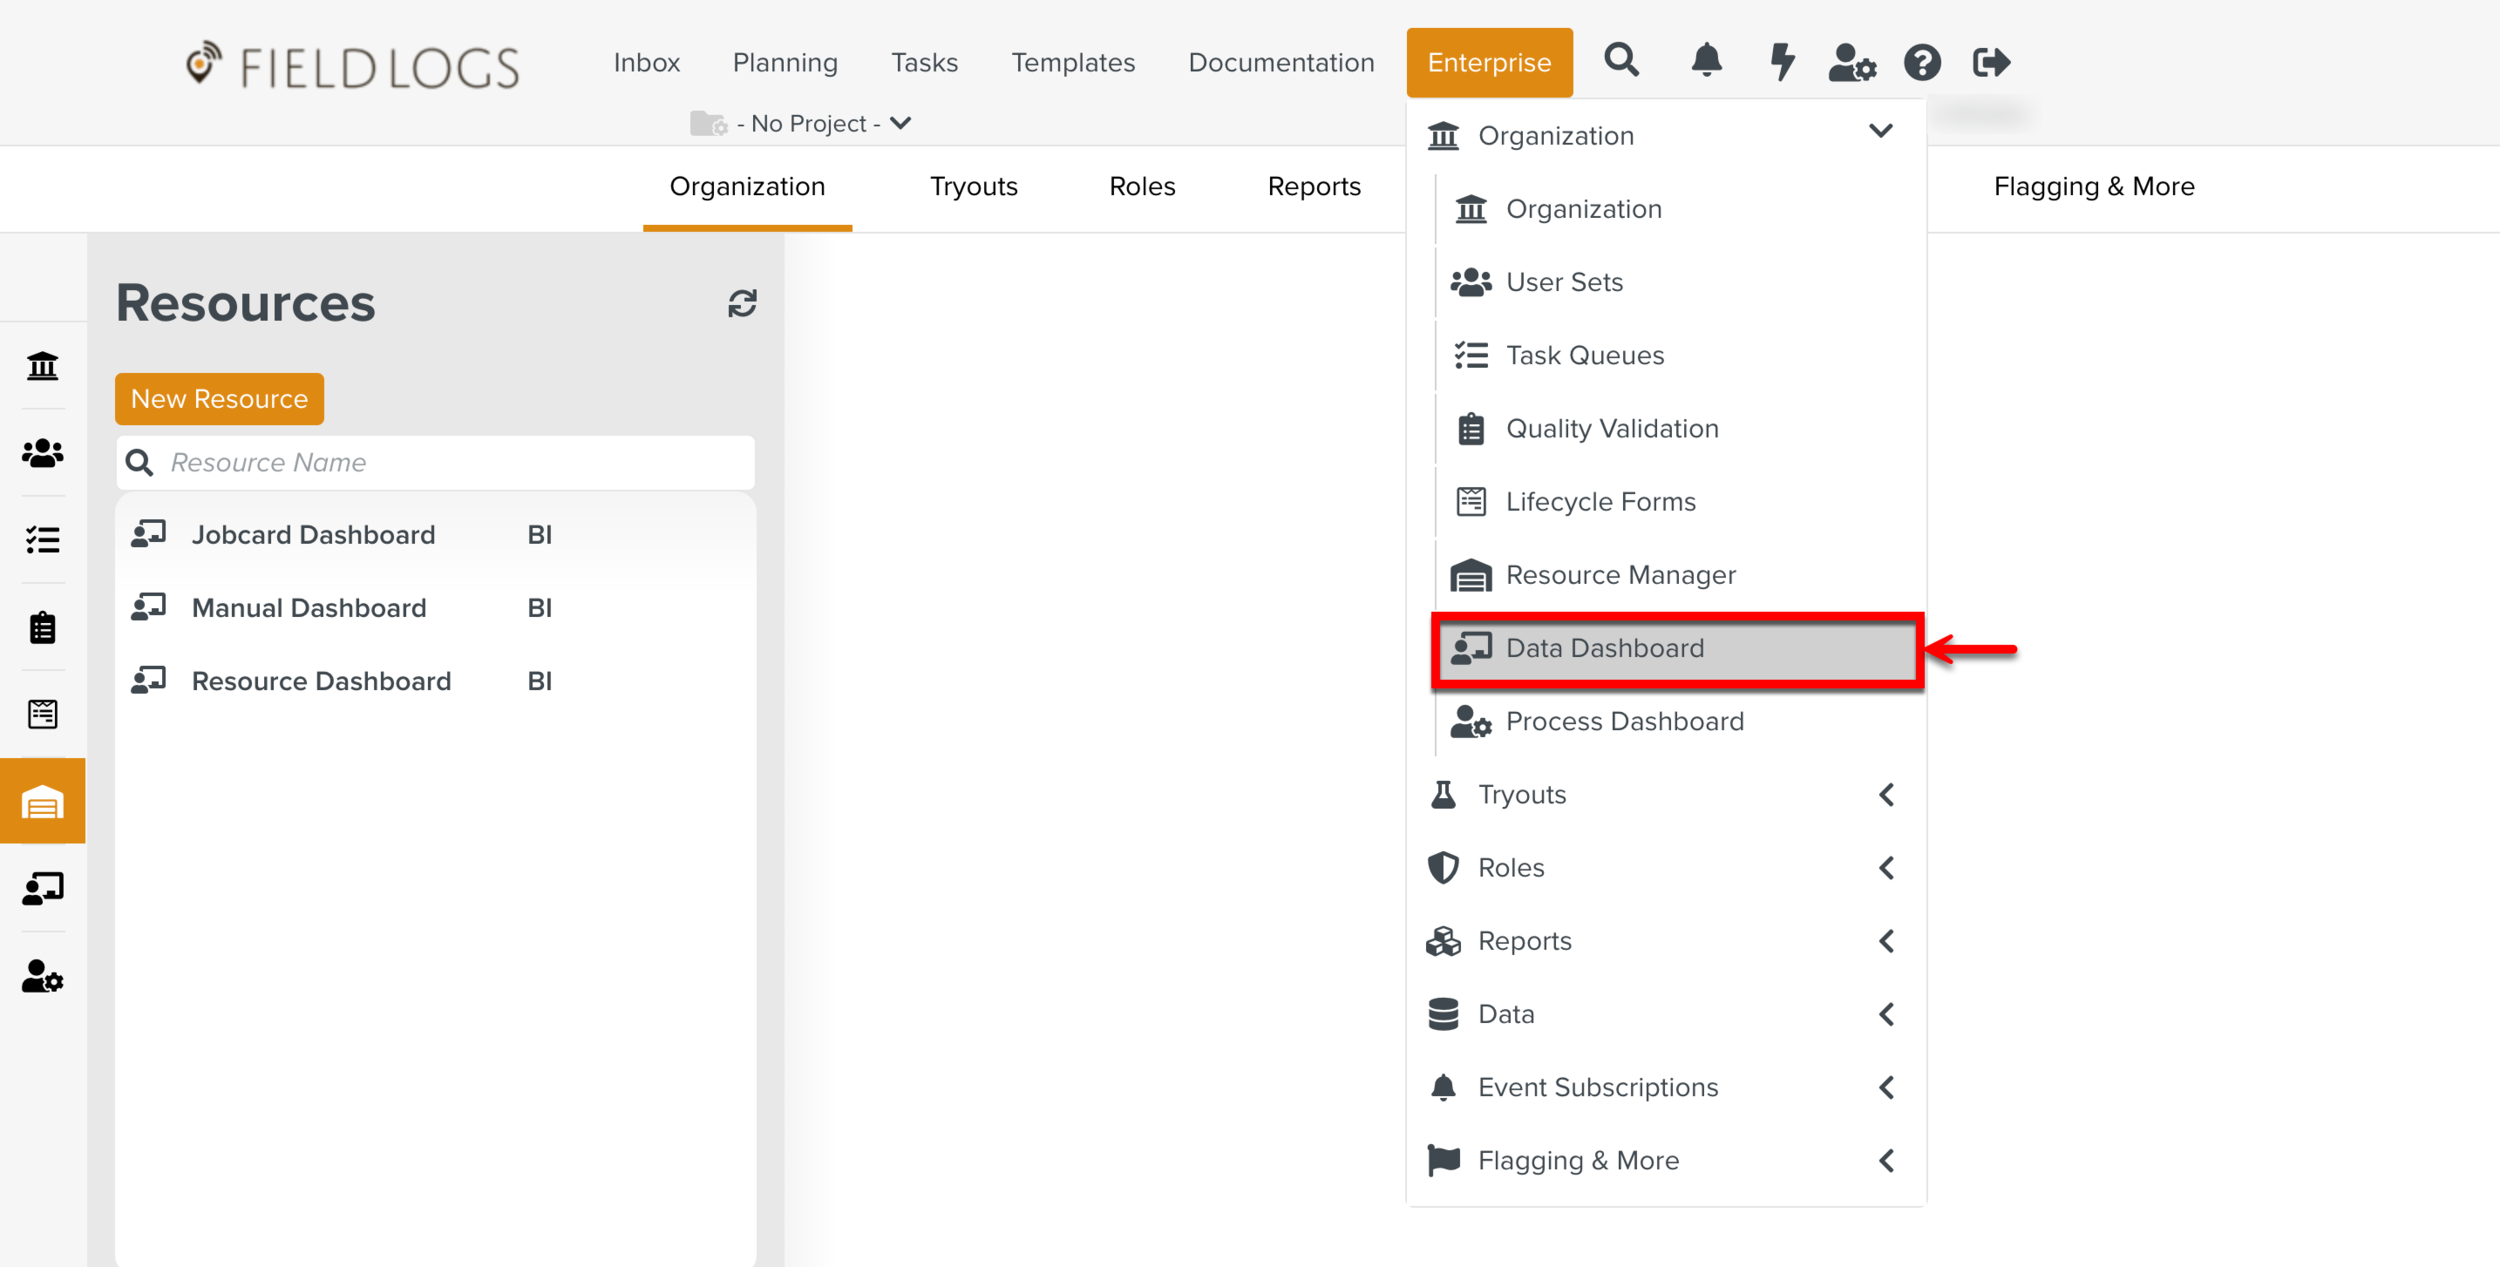
From the main menu, goto > > to view the Dashboards created.
The page Dashboards appear. You can use the search box to locate the required dashboard..
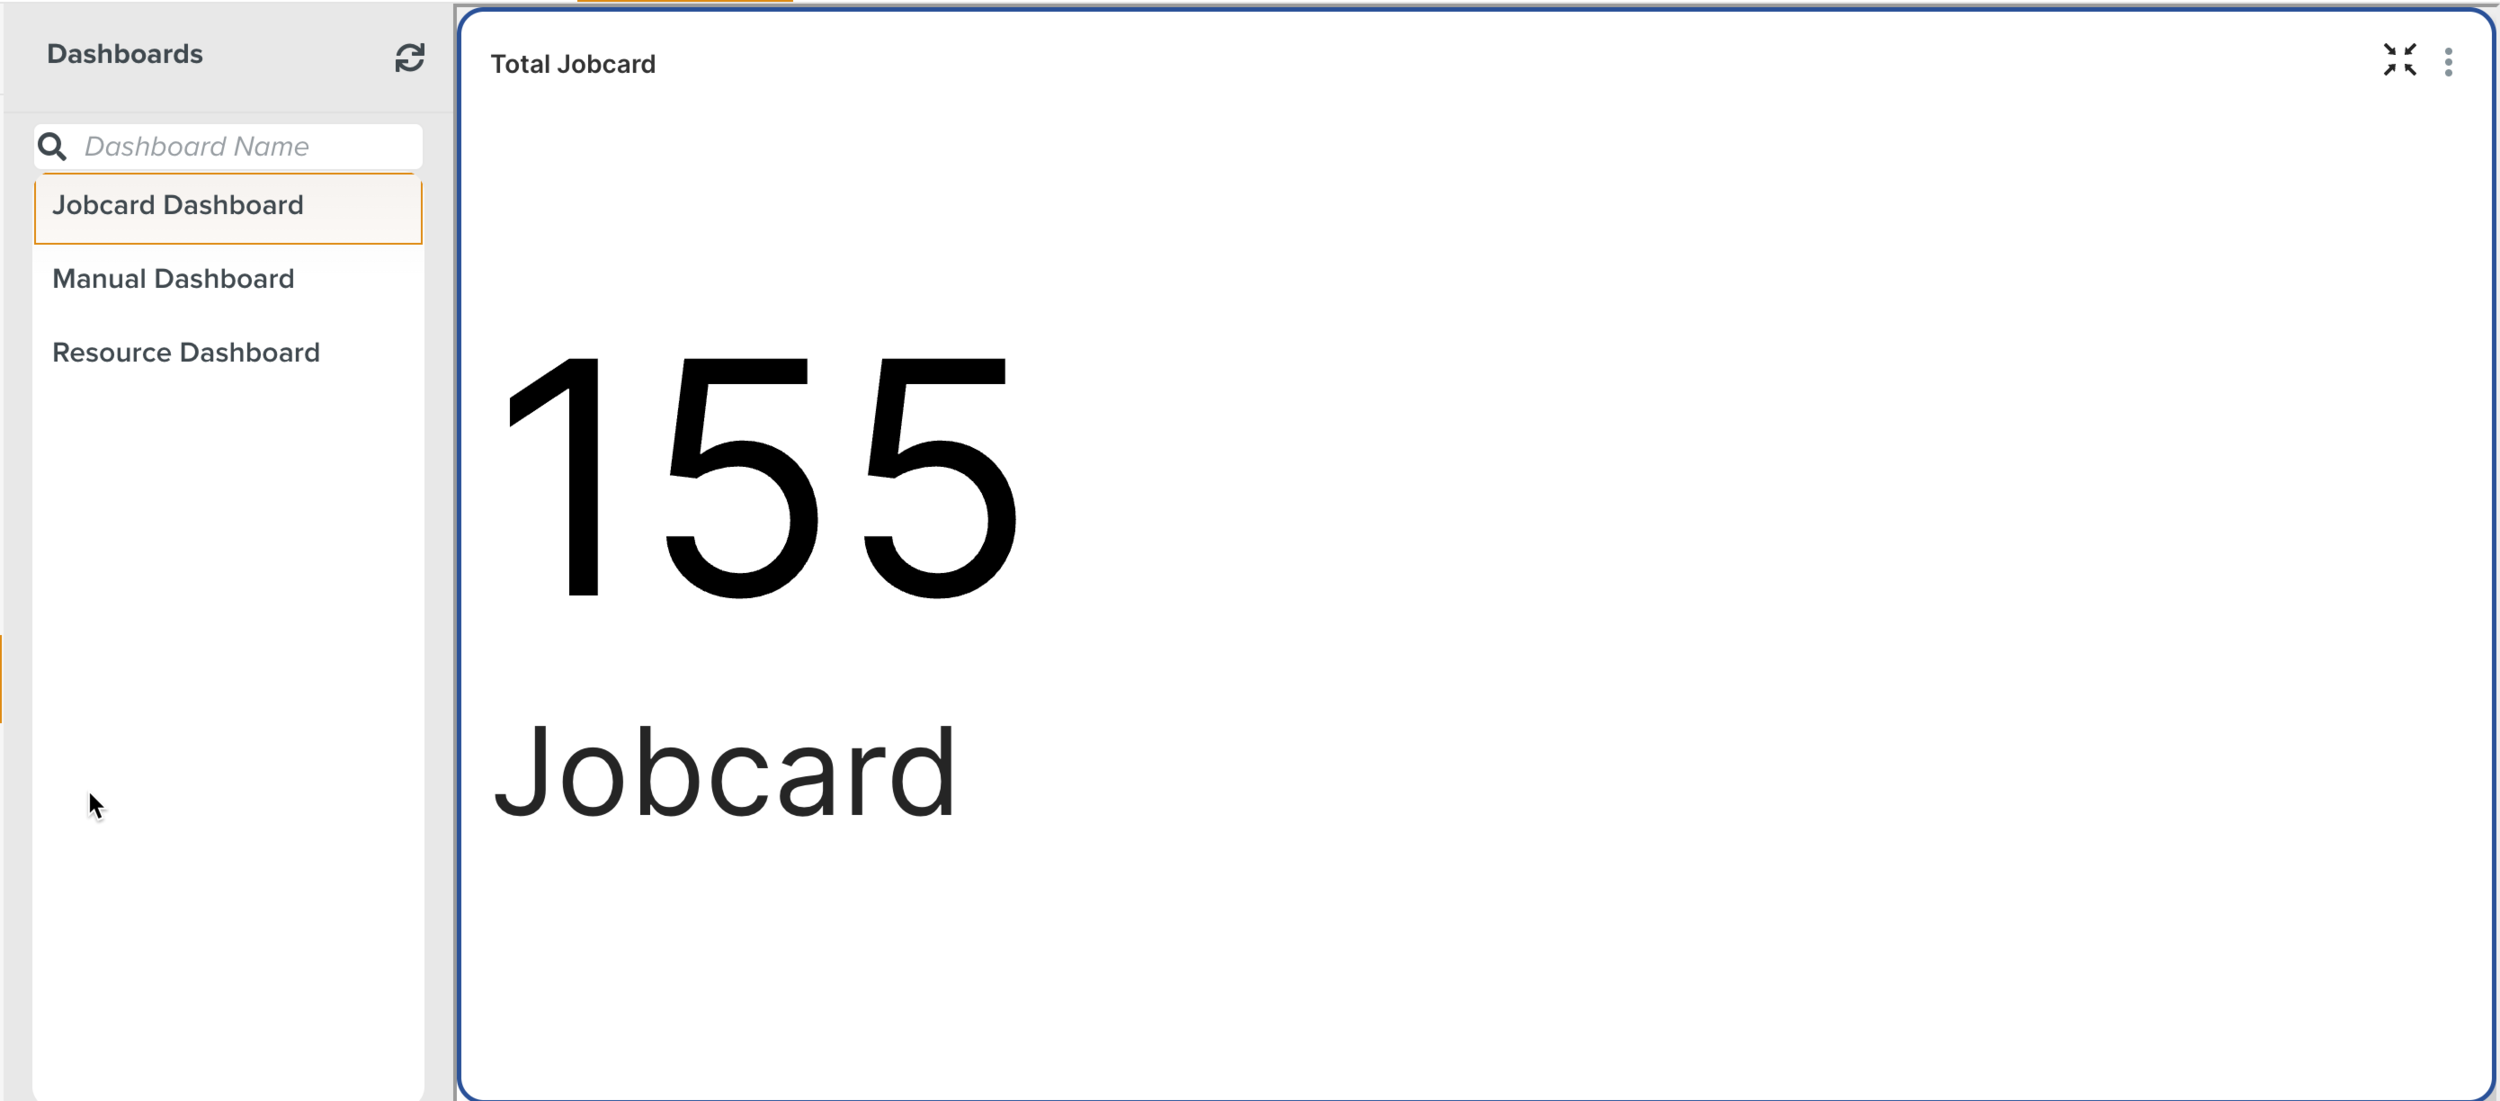
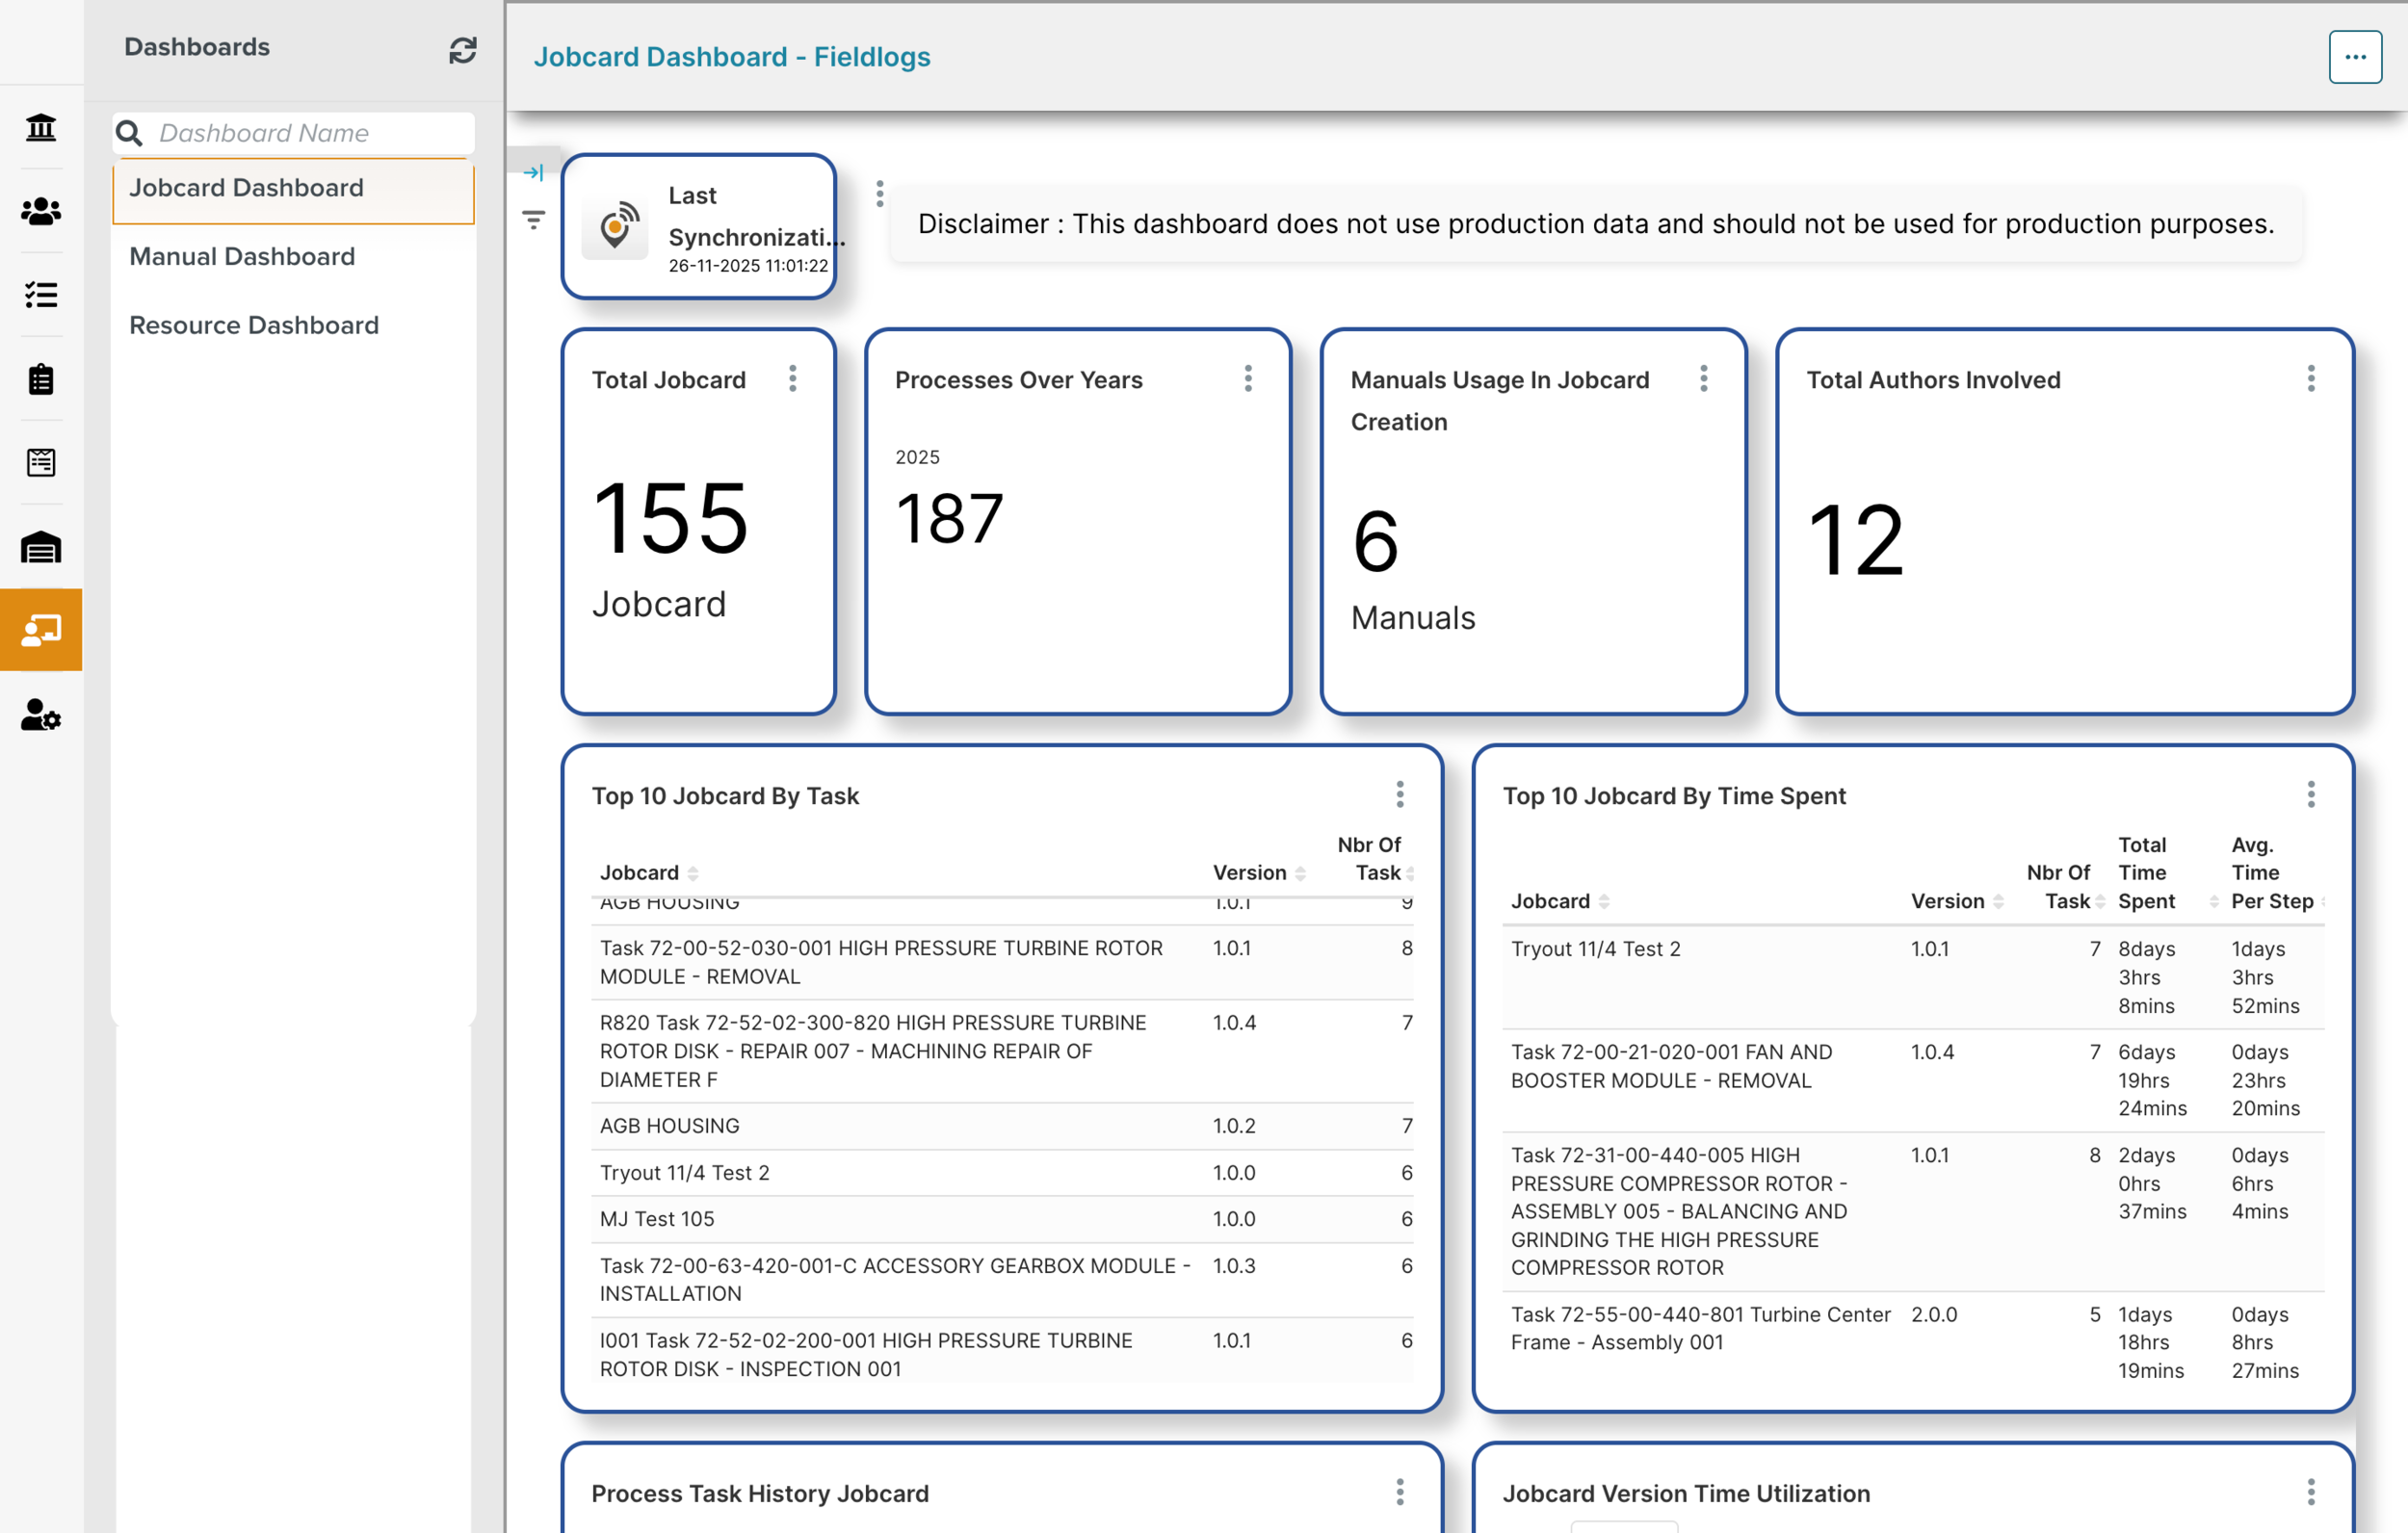
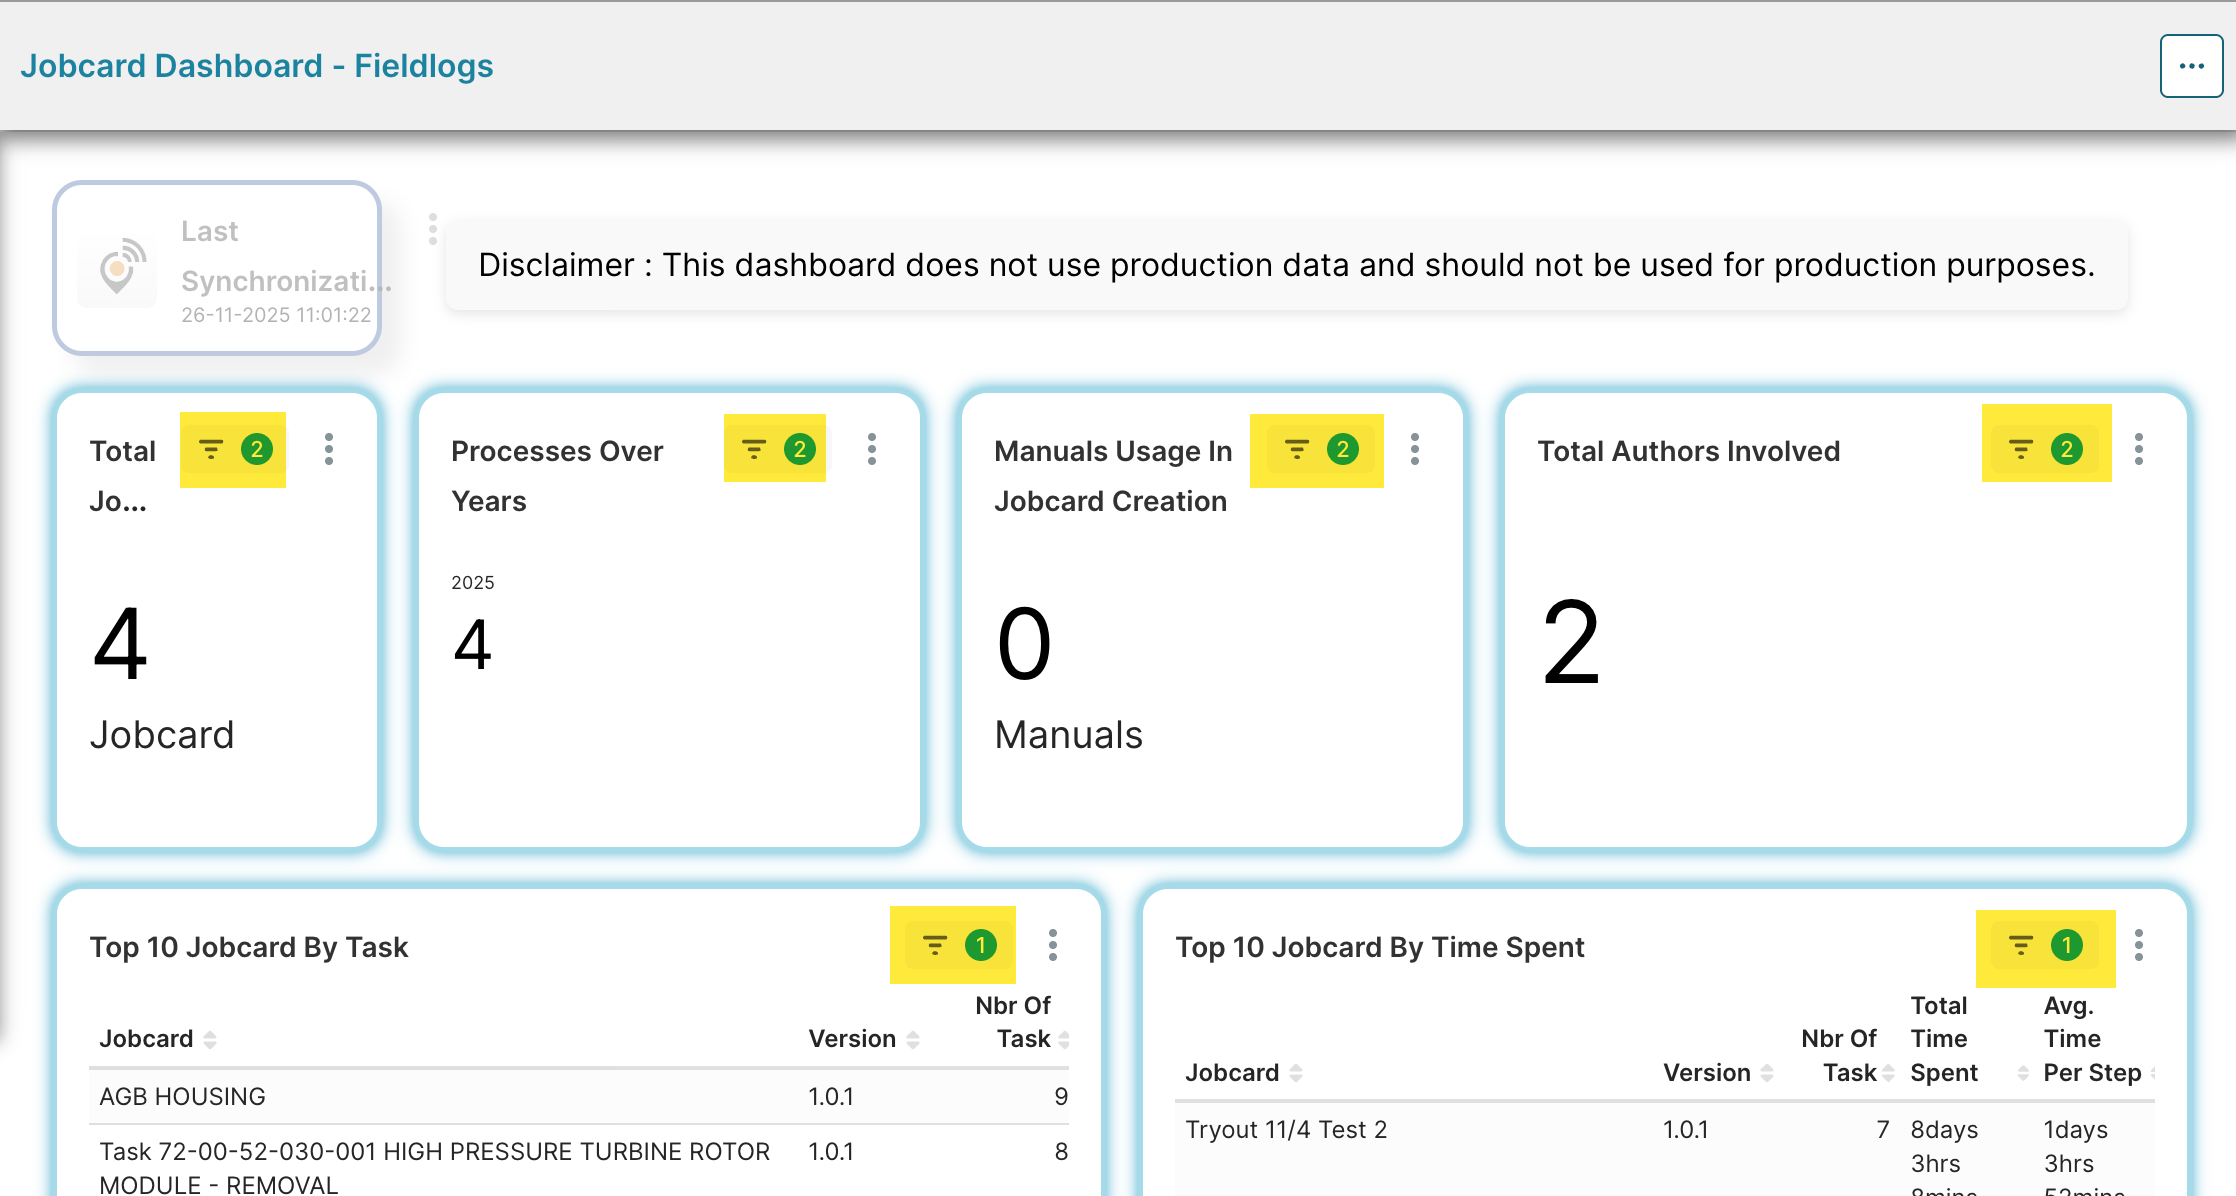
The example below highlights the Dashboard created for Jobcards. The Dashboard has charts, each of which provides specific information.
 |
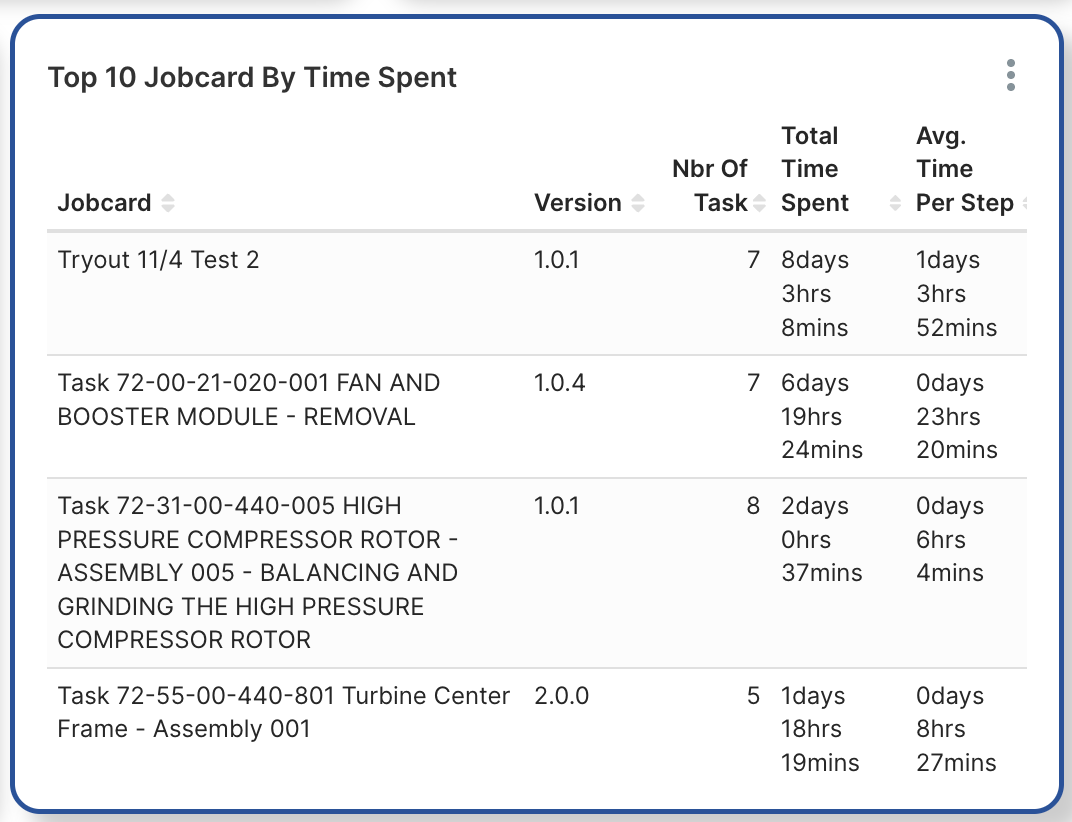
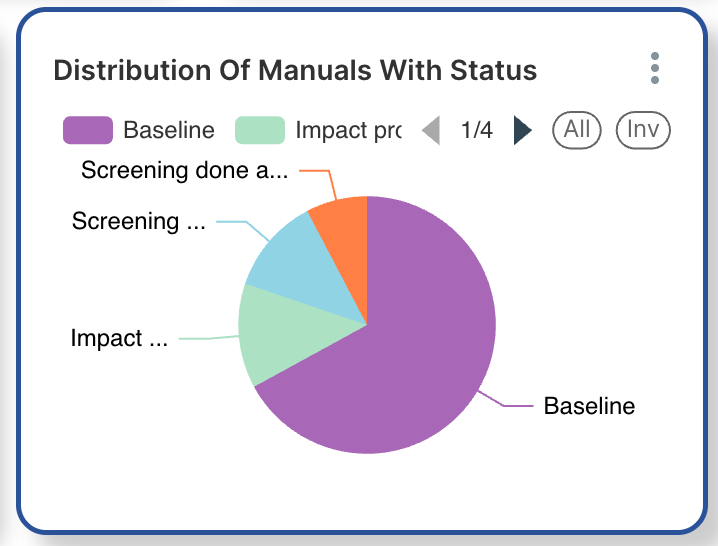
Various types of charts present the information in different formats. In the example below, the top 10 Jobcards with the highest time spent are presented in a table and the Manuals distribution across various statuses is displayed using a pie chart.
 |
 |
The Dashboard can be customized to meet your enterprise’s specific requirements.
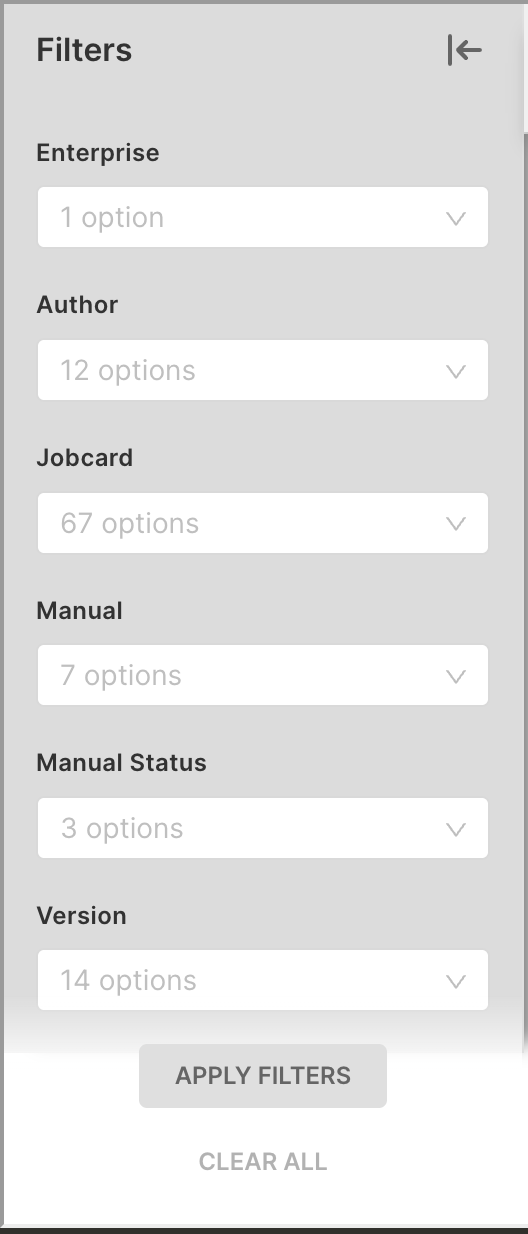
You can use filters to narrow down the Jobcards data displayed on the Dashboard.
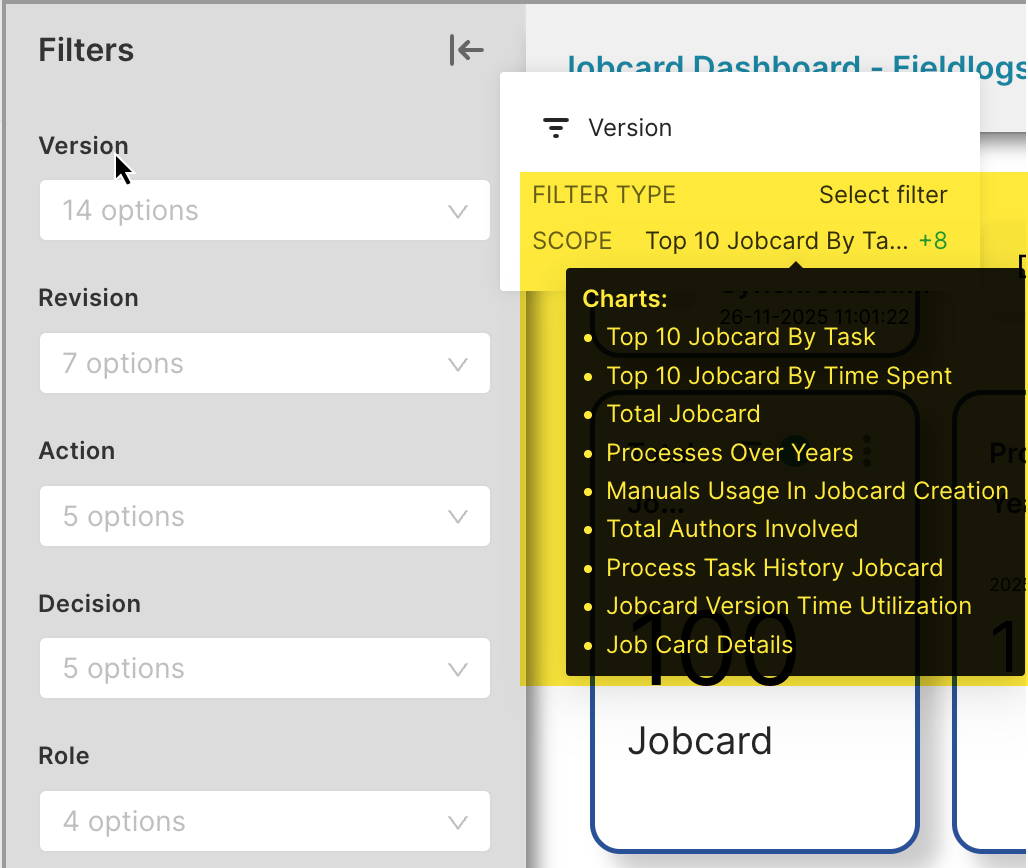
Click  to view the available filters. The scope of each filter is displayed when you hover over its name as shown below.
 |
 |
The available filters are listed below:
Filter Options | Description |
|---|---|
Enterprise | Filters the data based on the selected Project to which they belong to. |
Author | Filters the data based on the selected Template Author IDs. |
Jobcard | Filters the data based on the selected Template names. |
Manual | Filters the data based on the Manuals they are associated to. |
Manual Status | Filters the data based on the Manual statuses - Baseline, Screening started, etc. |
Version | Filters the data based on the respective Template versions. |
Revision | Filters the data based on the Manual revisions they are associated to. |
Action | Filters the data based on the selected Actions. |
Decision | Filters the data based on the selected Decisions. |
Role | Filters the data based on the selected Roles. |
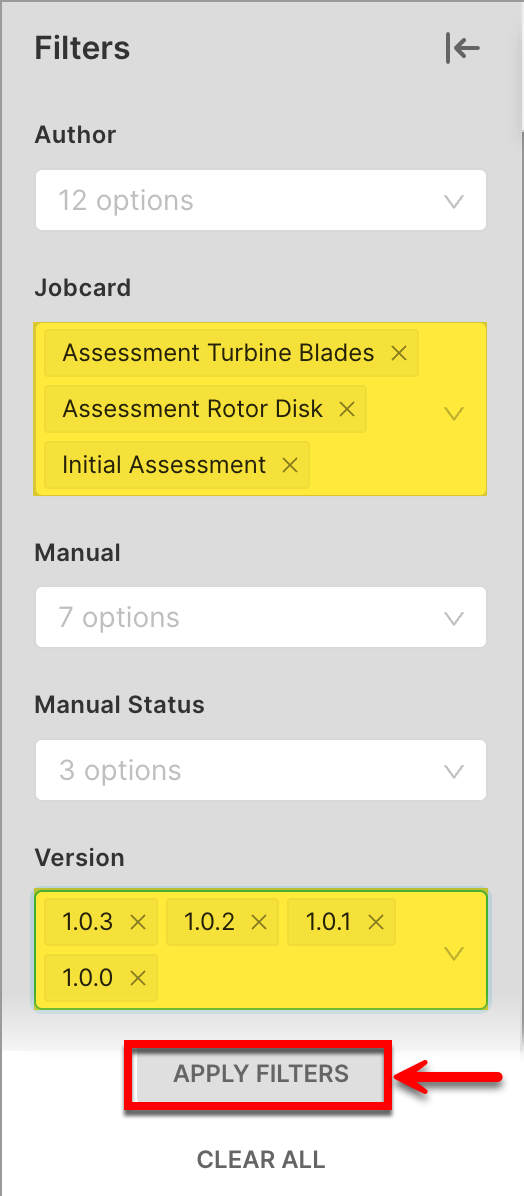
Select the required options from the filters dropdown and click . When the filters are applied, the data is refined and the respective tiles are indicated with the filter icon and the number of filters applied.
 |
 |
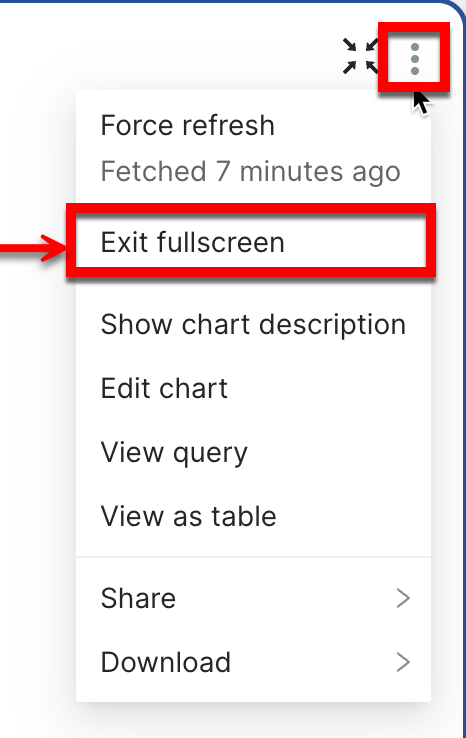
Click  on the top right corner of the Dashboard to access the following options.
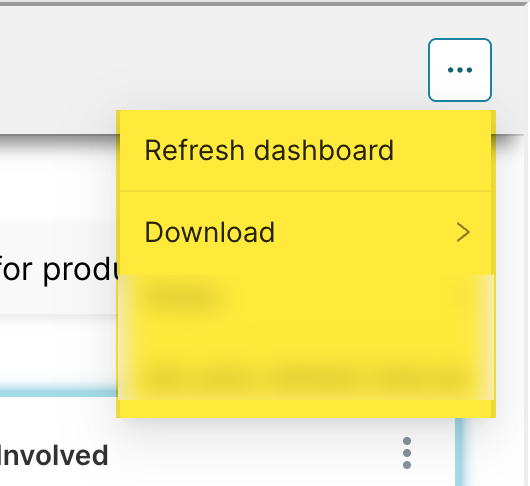 |
Refresh dashboard: Reloads the latest content of the Dashboard.
Download: Allows you to either export the Dashboard as a PDF file or download it as .JPG file.
There are some additional options available on each chart.
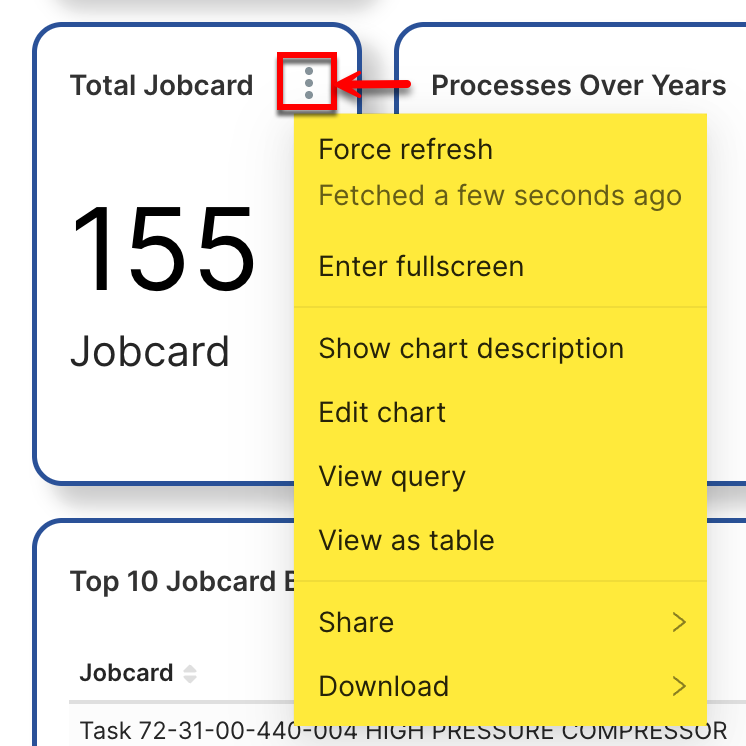 |
Select the options to perform the following actions:
Options | Actions | ||
|---|---|---|---|
Force refresh | Retrieve the latest data from the server. | ||
Enter fullscreen | Maximize the tile to fit the dashboard view.
You can exit fullscreen by clicking
| ||
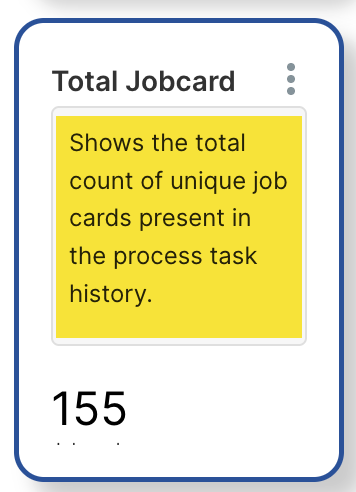
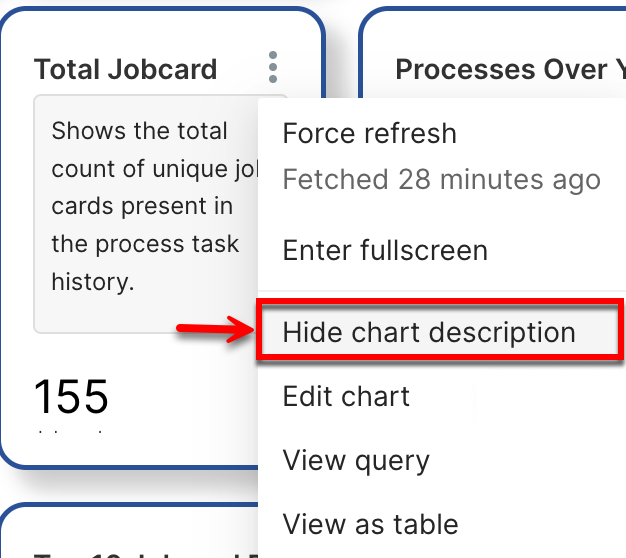
Show chart description | View the chart description.
To hide the description, click Hide chart description.
| ||
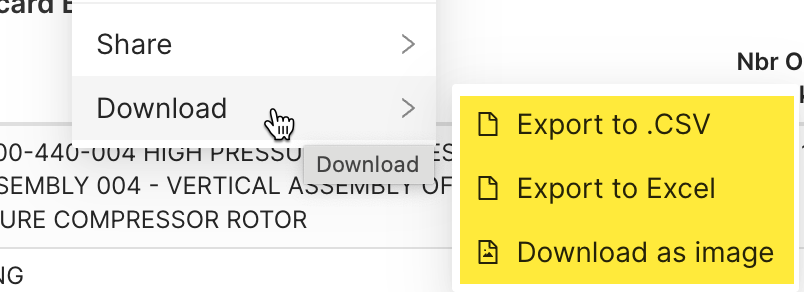
Download | Export the tile as a .CSV or excel file or download it is as an image.
|