Creating a Report
To create a report, it is mandatory to select a model. A model is a structure defined according to your requirements, to display the data with a certain outlook. The model (uploaded as a zipped file) comprises the following files:
.ftl file — defines the structure/outlook of the report.
configuration.json file — provides the inputs for the report.
The configuration.json file contains a list of variable configurations that define the data type and the data source type for the report. The data type could be a job, dataset, Custom Operation Plan (COP), executed template, task, user set, role, or an enterprise project. The data source type could be a search query, template ID, dataset ID, or COP ID.
For customized report generation, corresponding options are displayed on the screen that allow you to select from a list of data pertaining to the report type. These options are enabled when a user input .json file is uploaded in addition to the zipped file containing the .ftl file and configuration.json file.
To create a report:
On the main menu, go to > > .
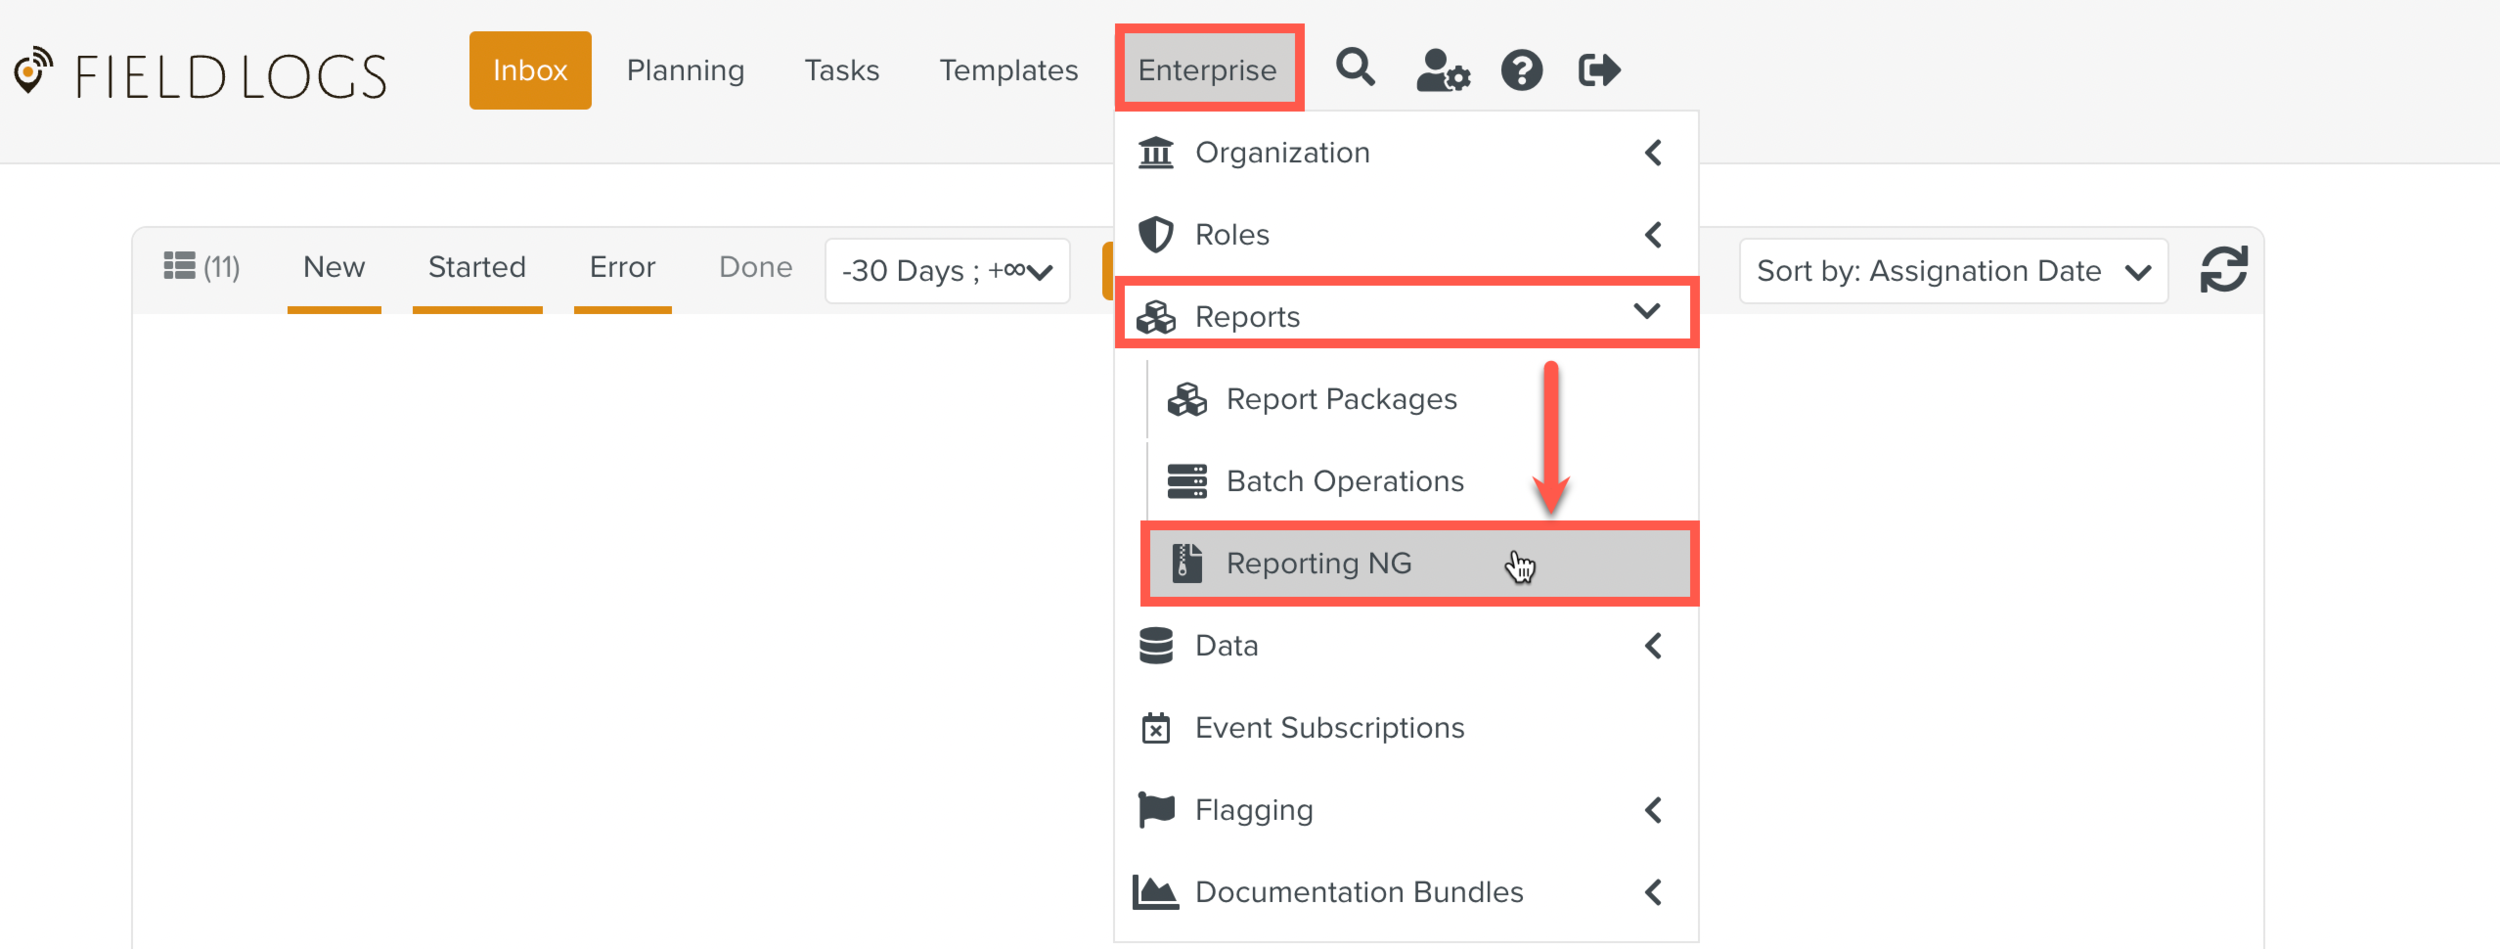
The Reporting NG page is displayed.
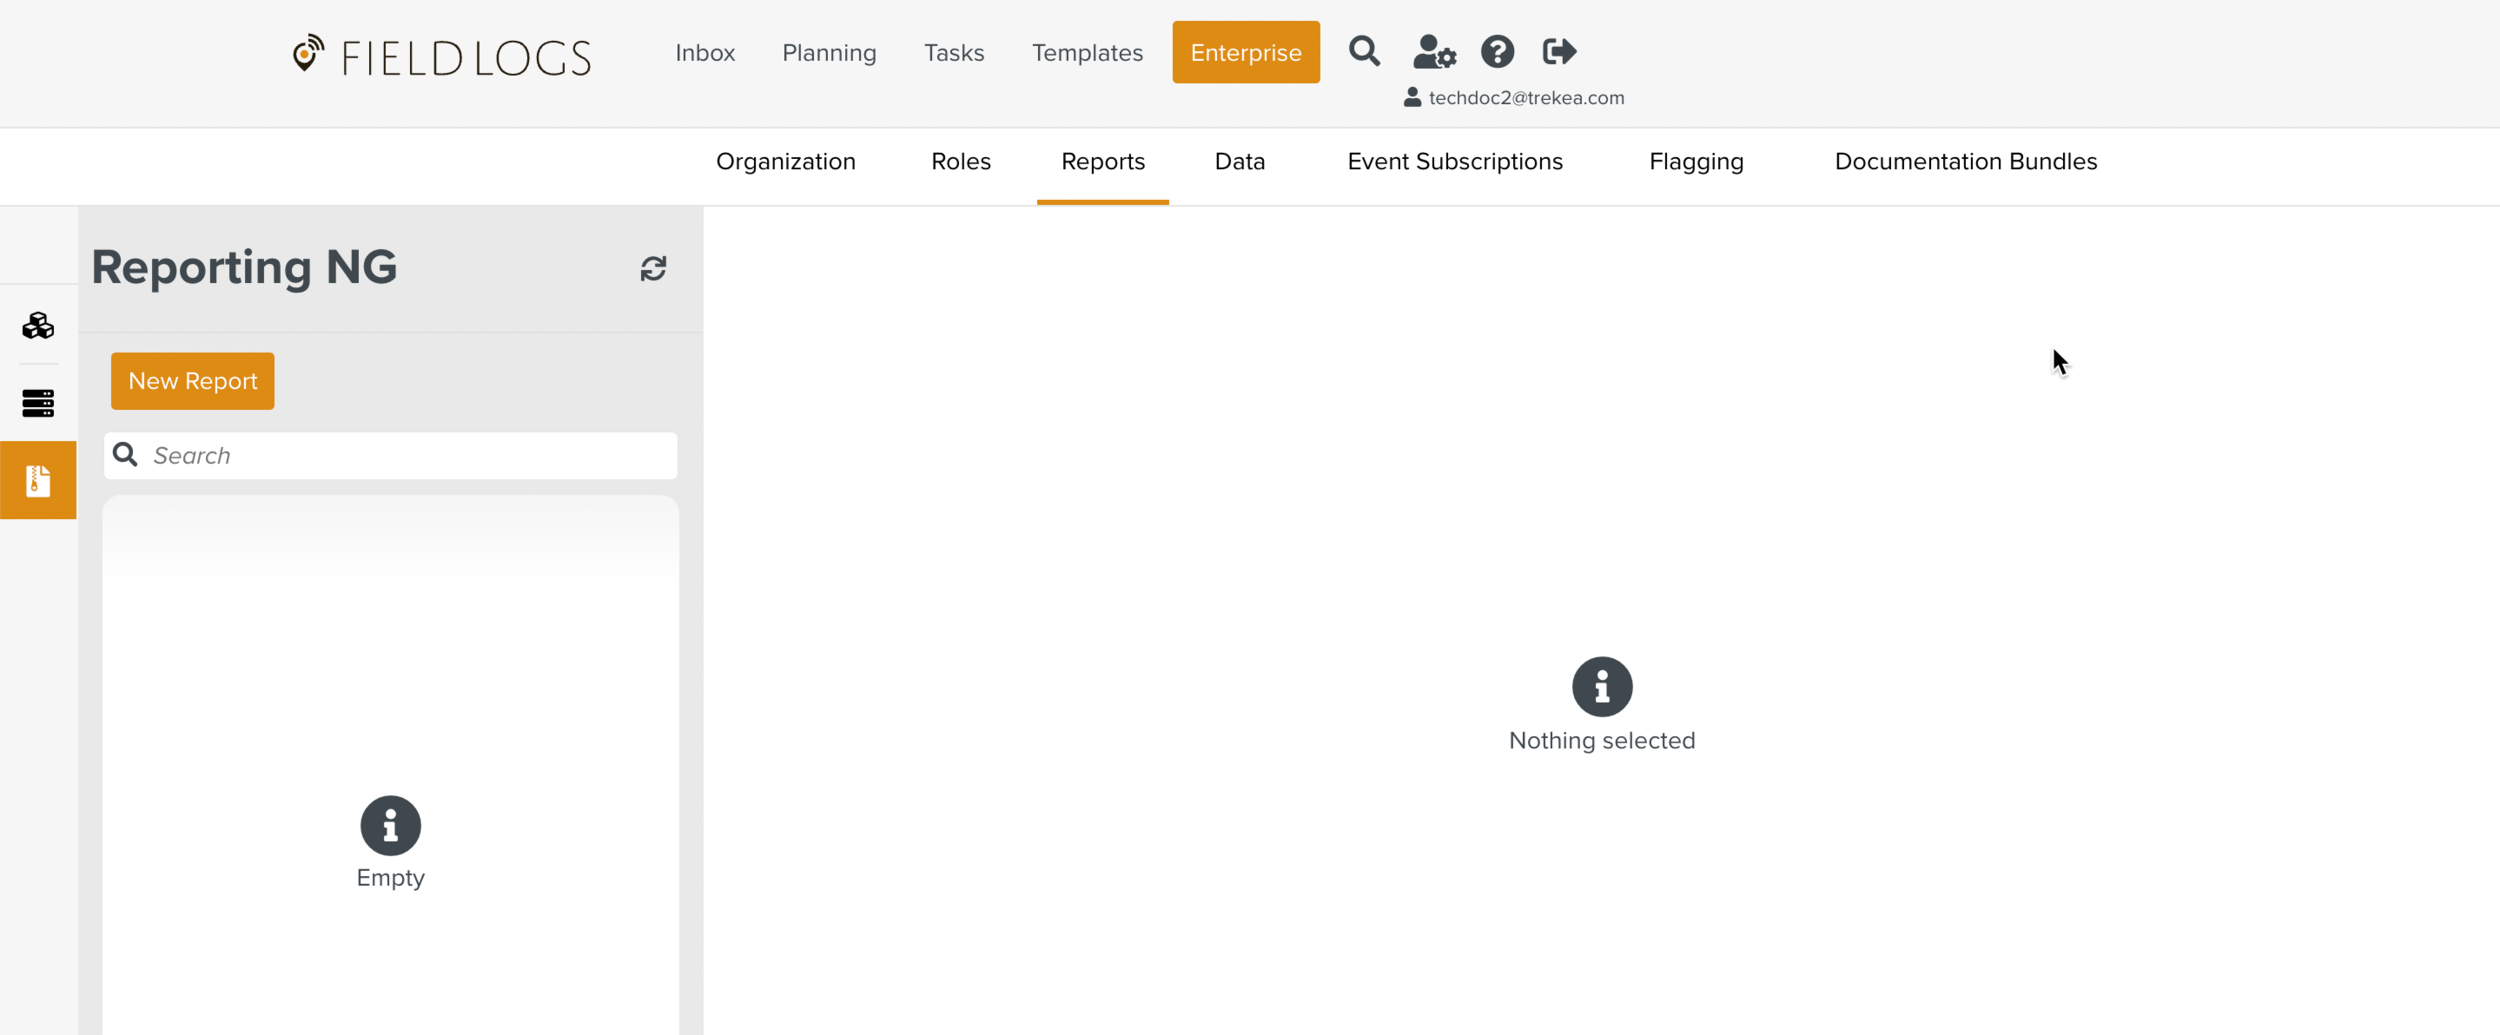
Click .
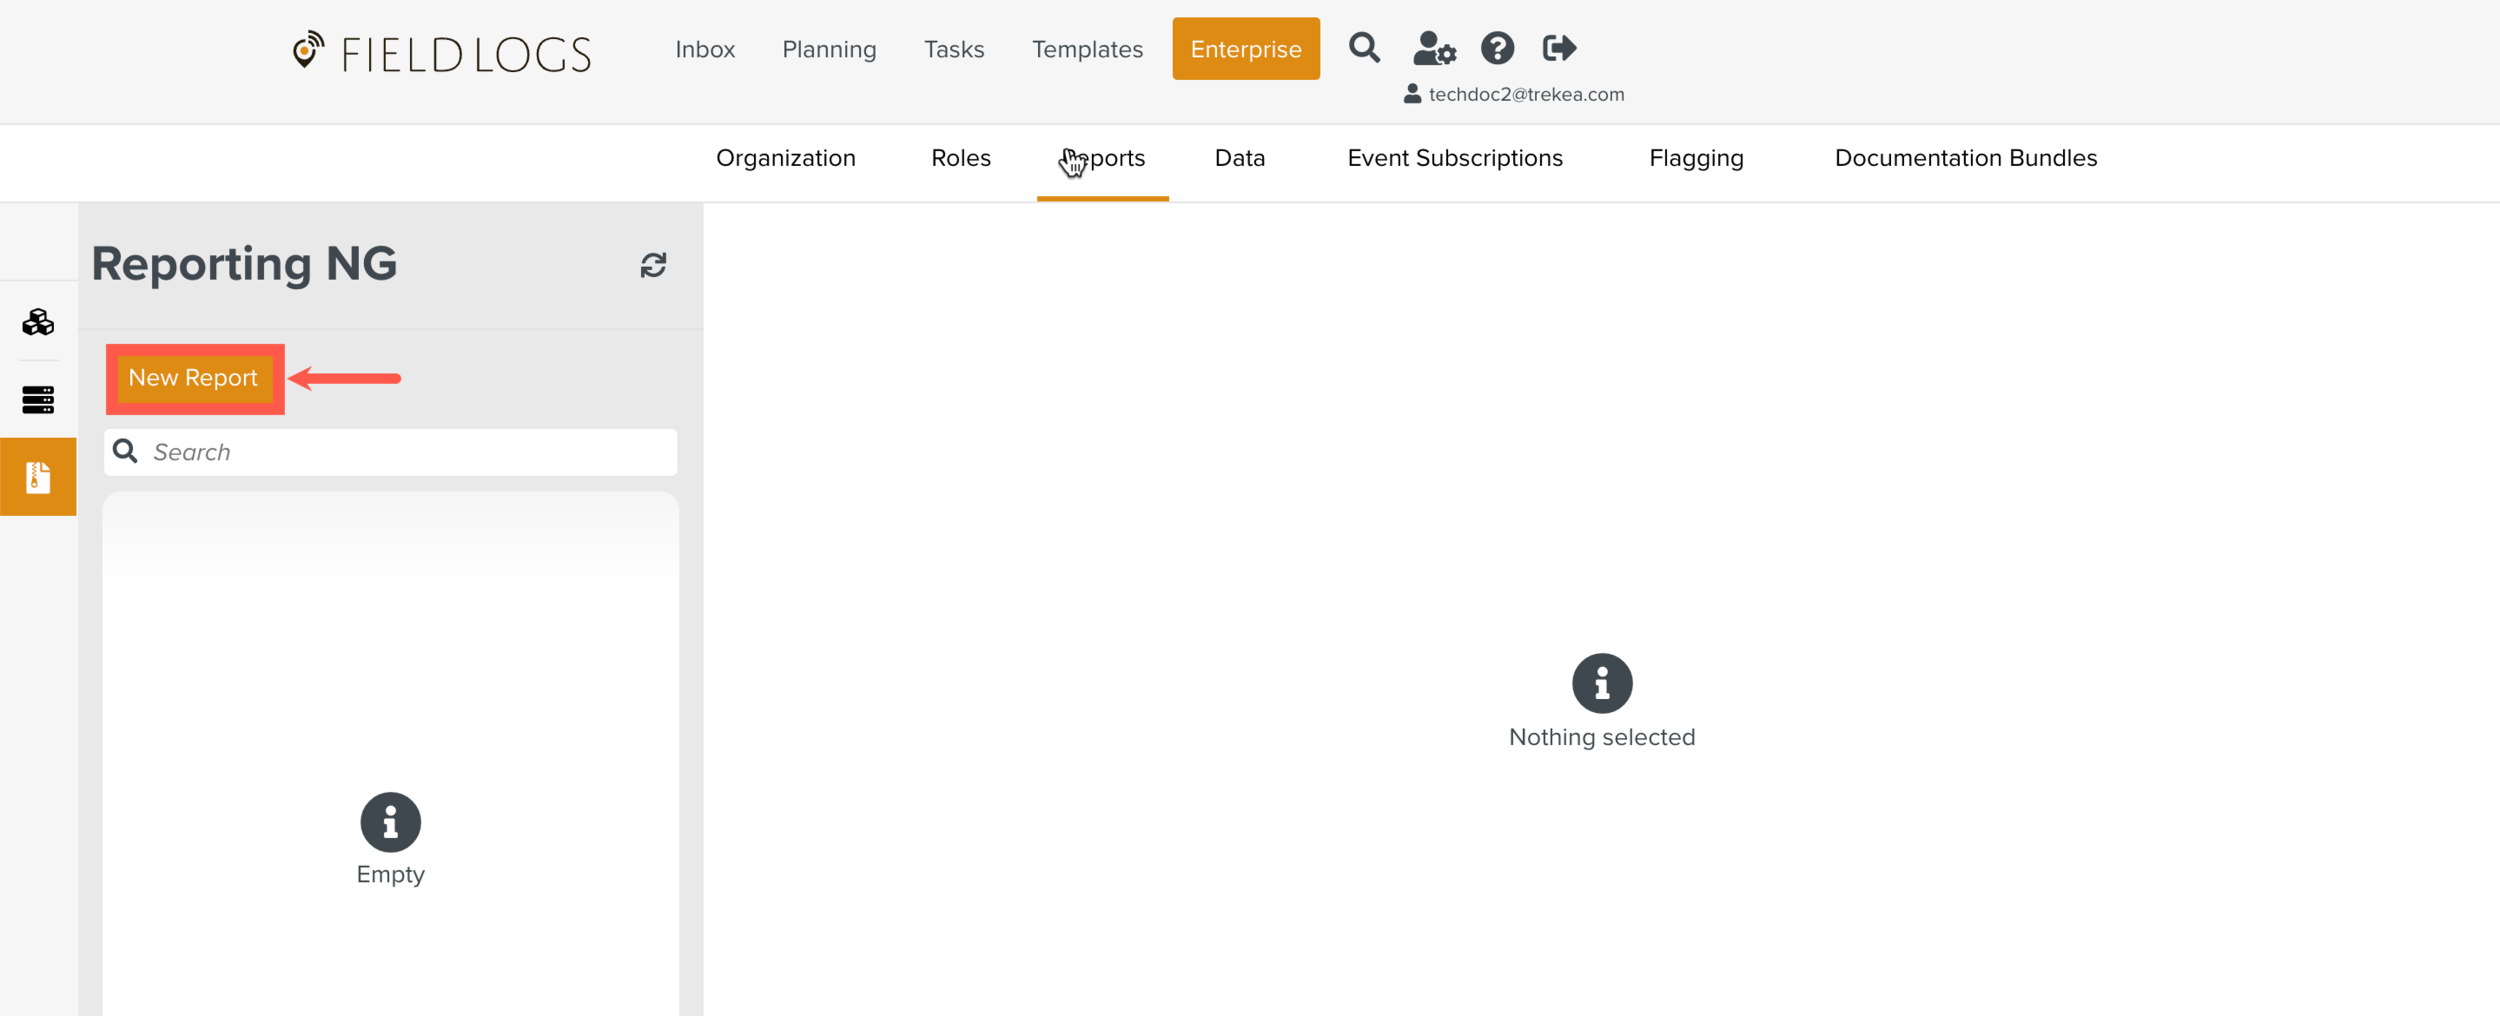
A new window is displayed.
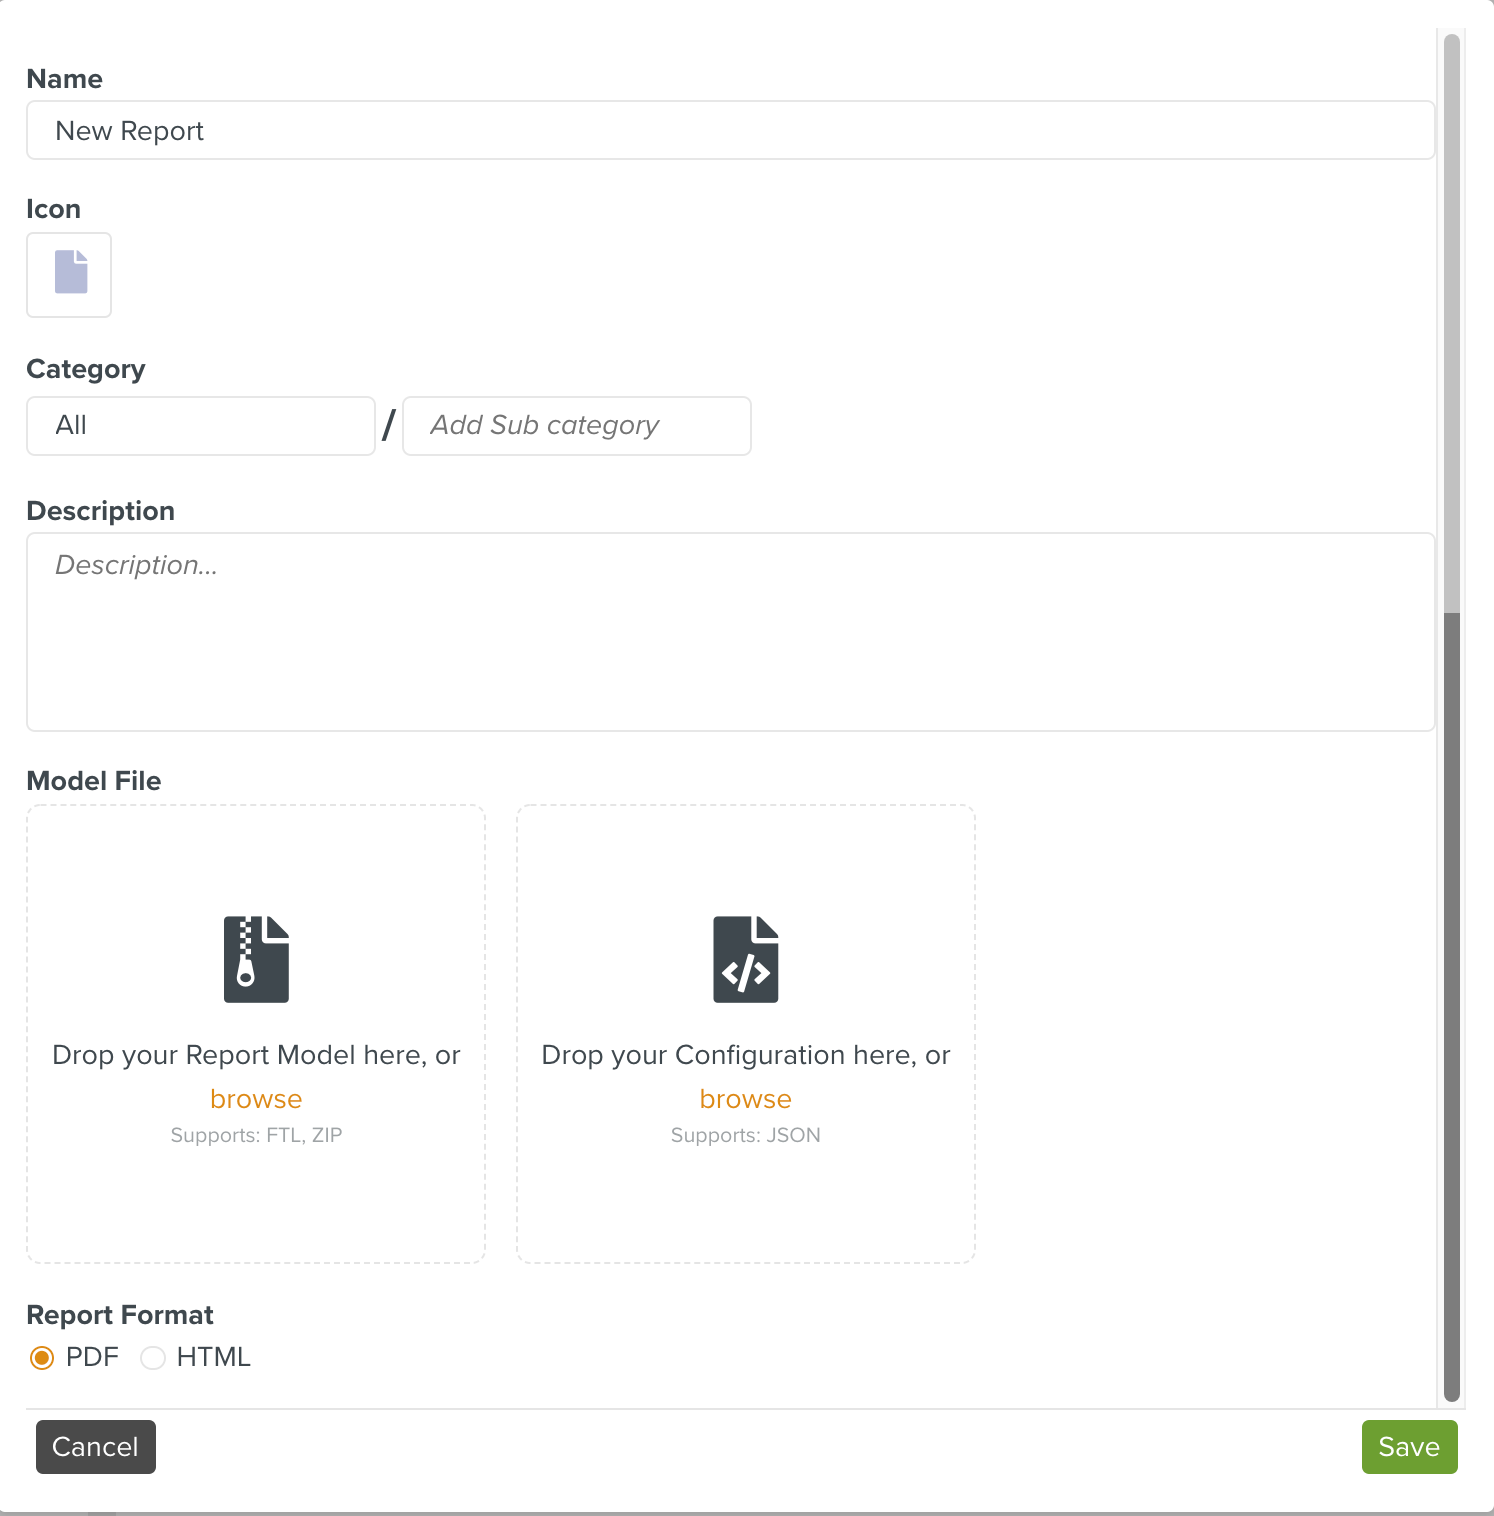
Add details in the following fields as needed:
Field
Description
Name
Enter the name of the report.
Icon
If needed, choose an icon and color.
To choose an icon:
Click
 .
.Select the icon from the list or use the search field to find the icon and then select it.
To choose the color:
Click .

Select a color from the color picker or click to specify the RGB values.
Category
Enter the main category under which you want to save the report. By default, category is displayed.
If you do not specify the category while creating the report, the report is automatically listed under the category . You can modify the category at any time.
Sub category
Enter the subcategory. You can add any number of subcategories.
Description
Enter a brief description of the report.
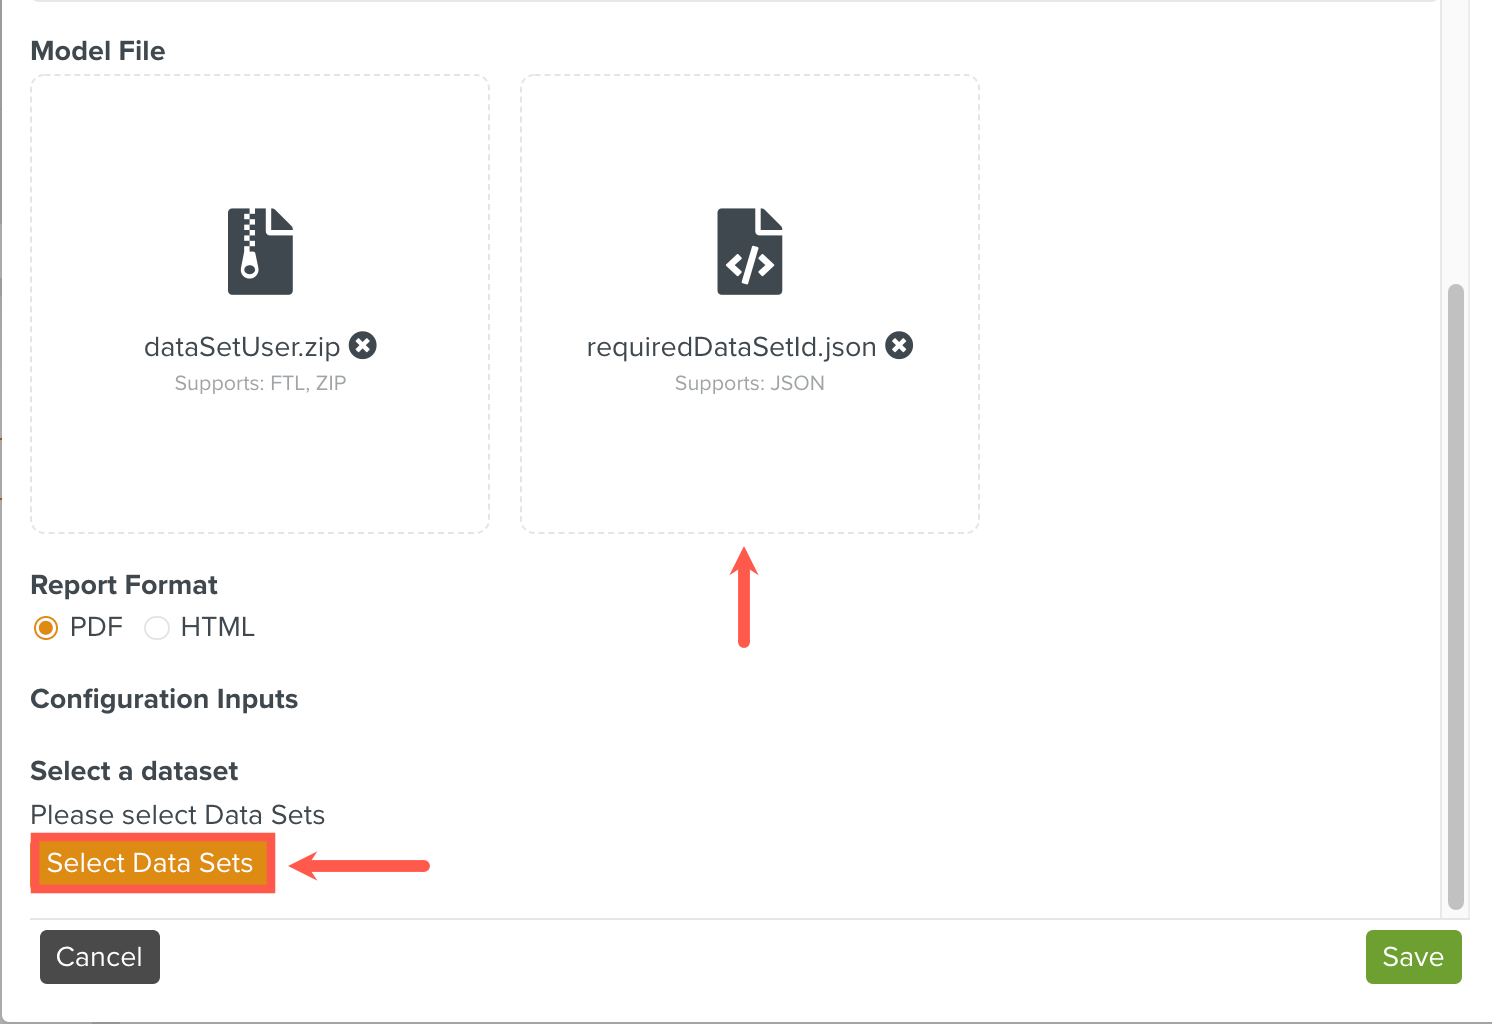
Model File
This is a required field. The report can be executed only if the model file has been uploaded.
In the first box, a ZIP file containing the file and the file is uploaded.
If the report generation needs to be customized, the user input .json file is uploaded in the second box. This enables you to select the inputs on the screen.
Configuration Inputs
The section is available if the user input .json file has been uploaded in the second box. In this section, you can select the inputs.
In the following example, a user input .json file to select datasets has been uploaded in the second box. Notice that the button is enabled. You can click to select one or more datasets from the list of available datasets and then click . The dataset(s) is/are selected.
Depending on the data source type specified in the user input .json file, you may need to select a template, project, task queue, operation plan or type the keyword for a particular task/template or select a suite/package.
Report Format
Choose PDF or HTML as needed.
Click .
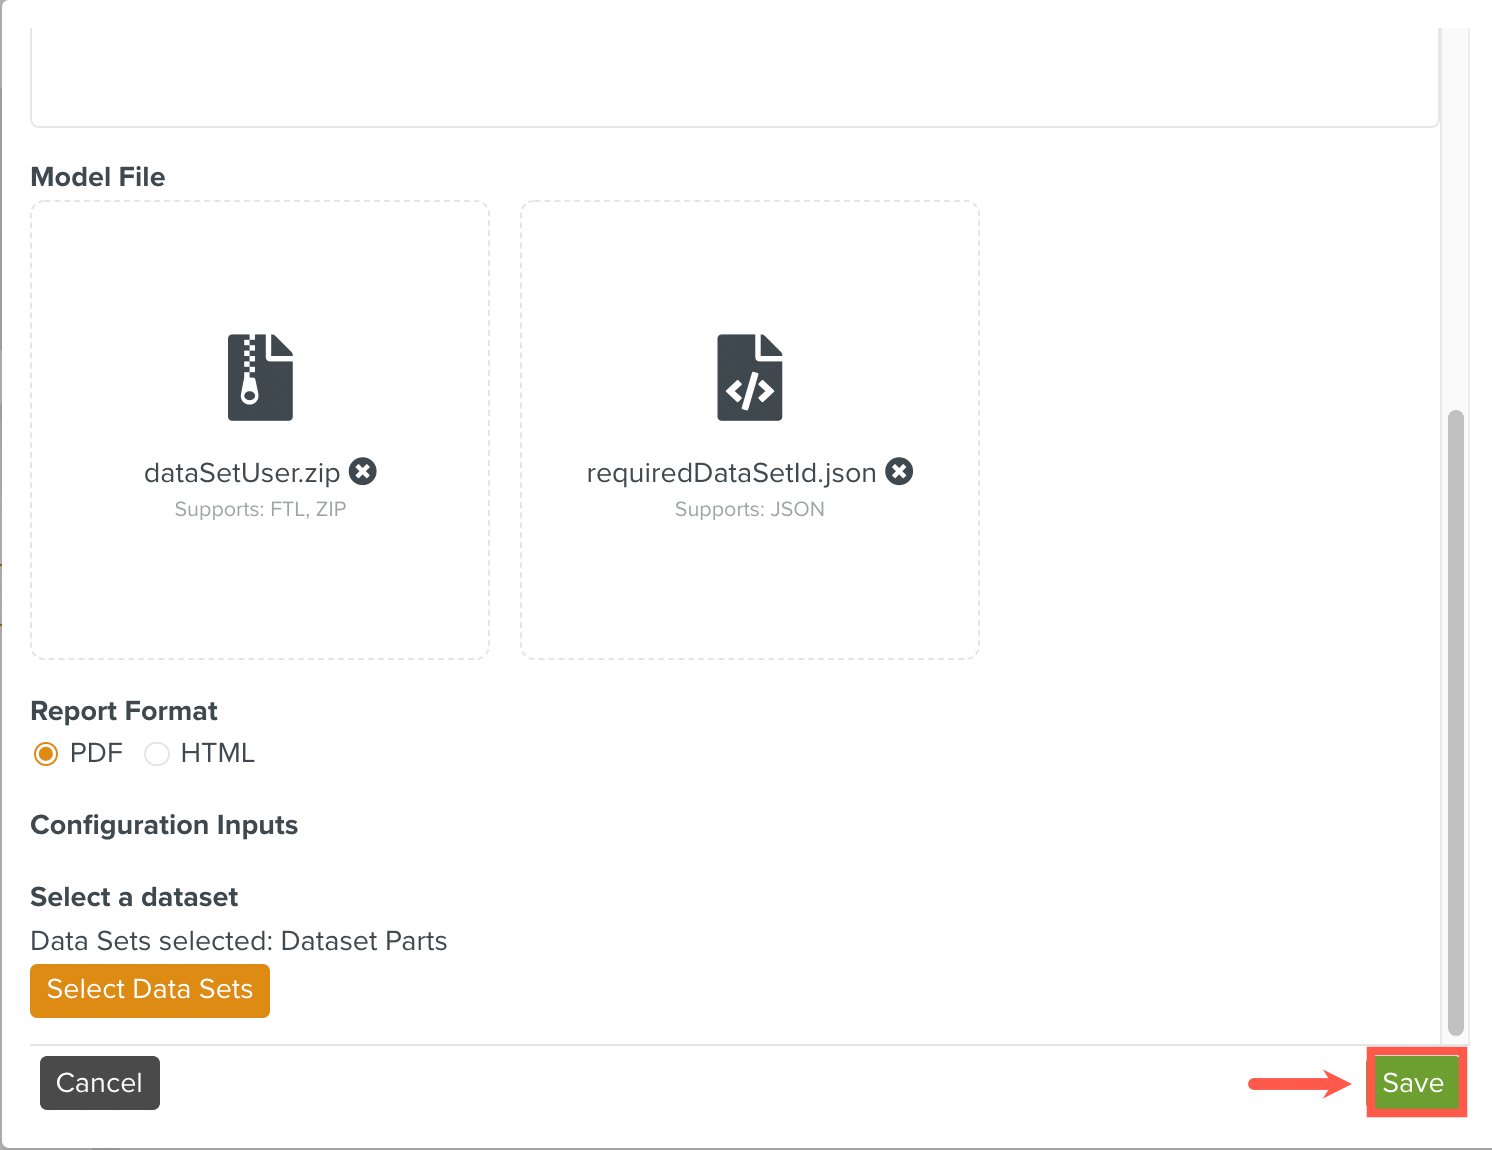
The details are saved and the button is enabled.
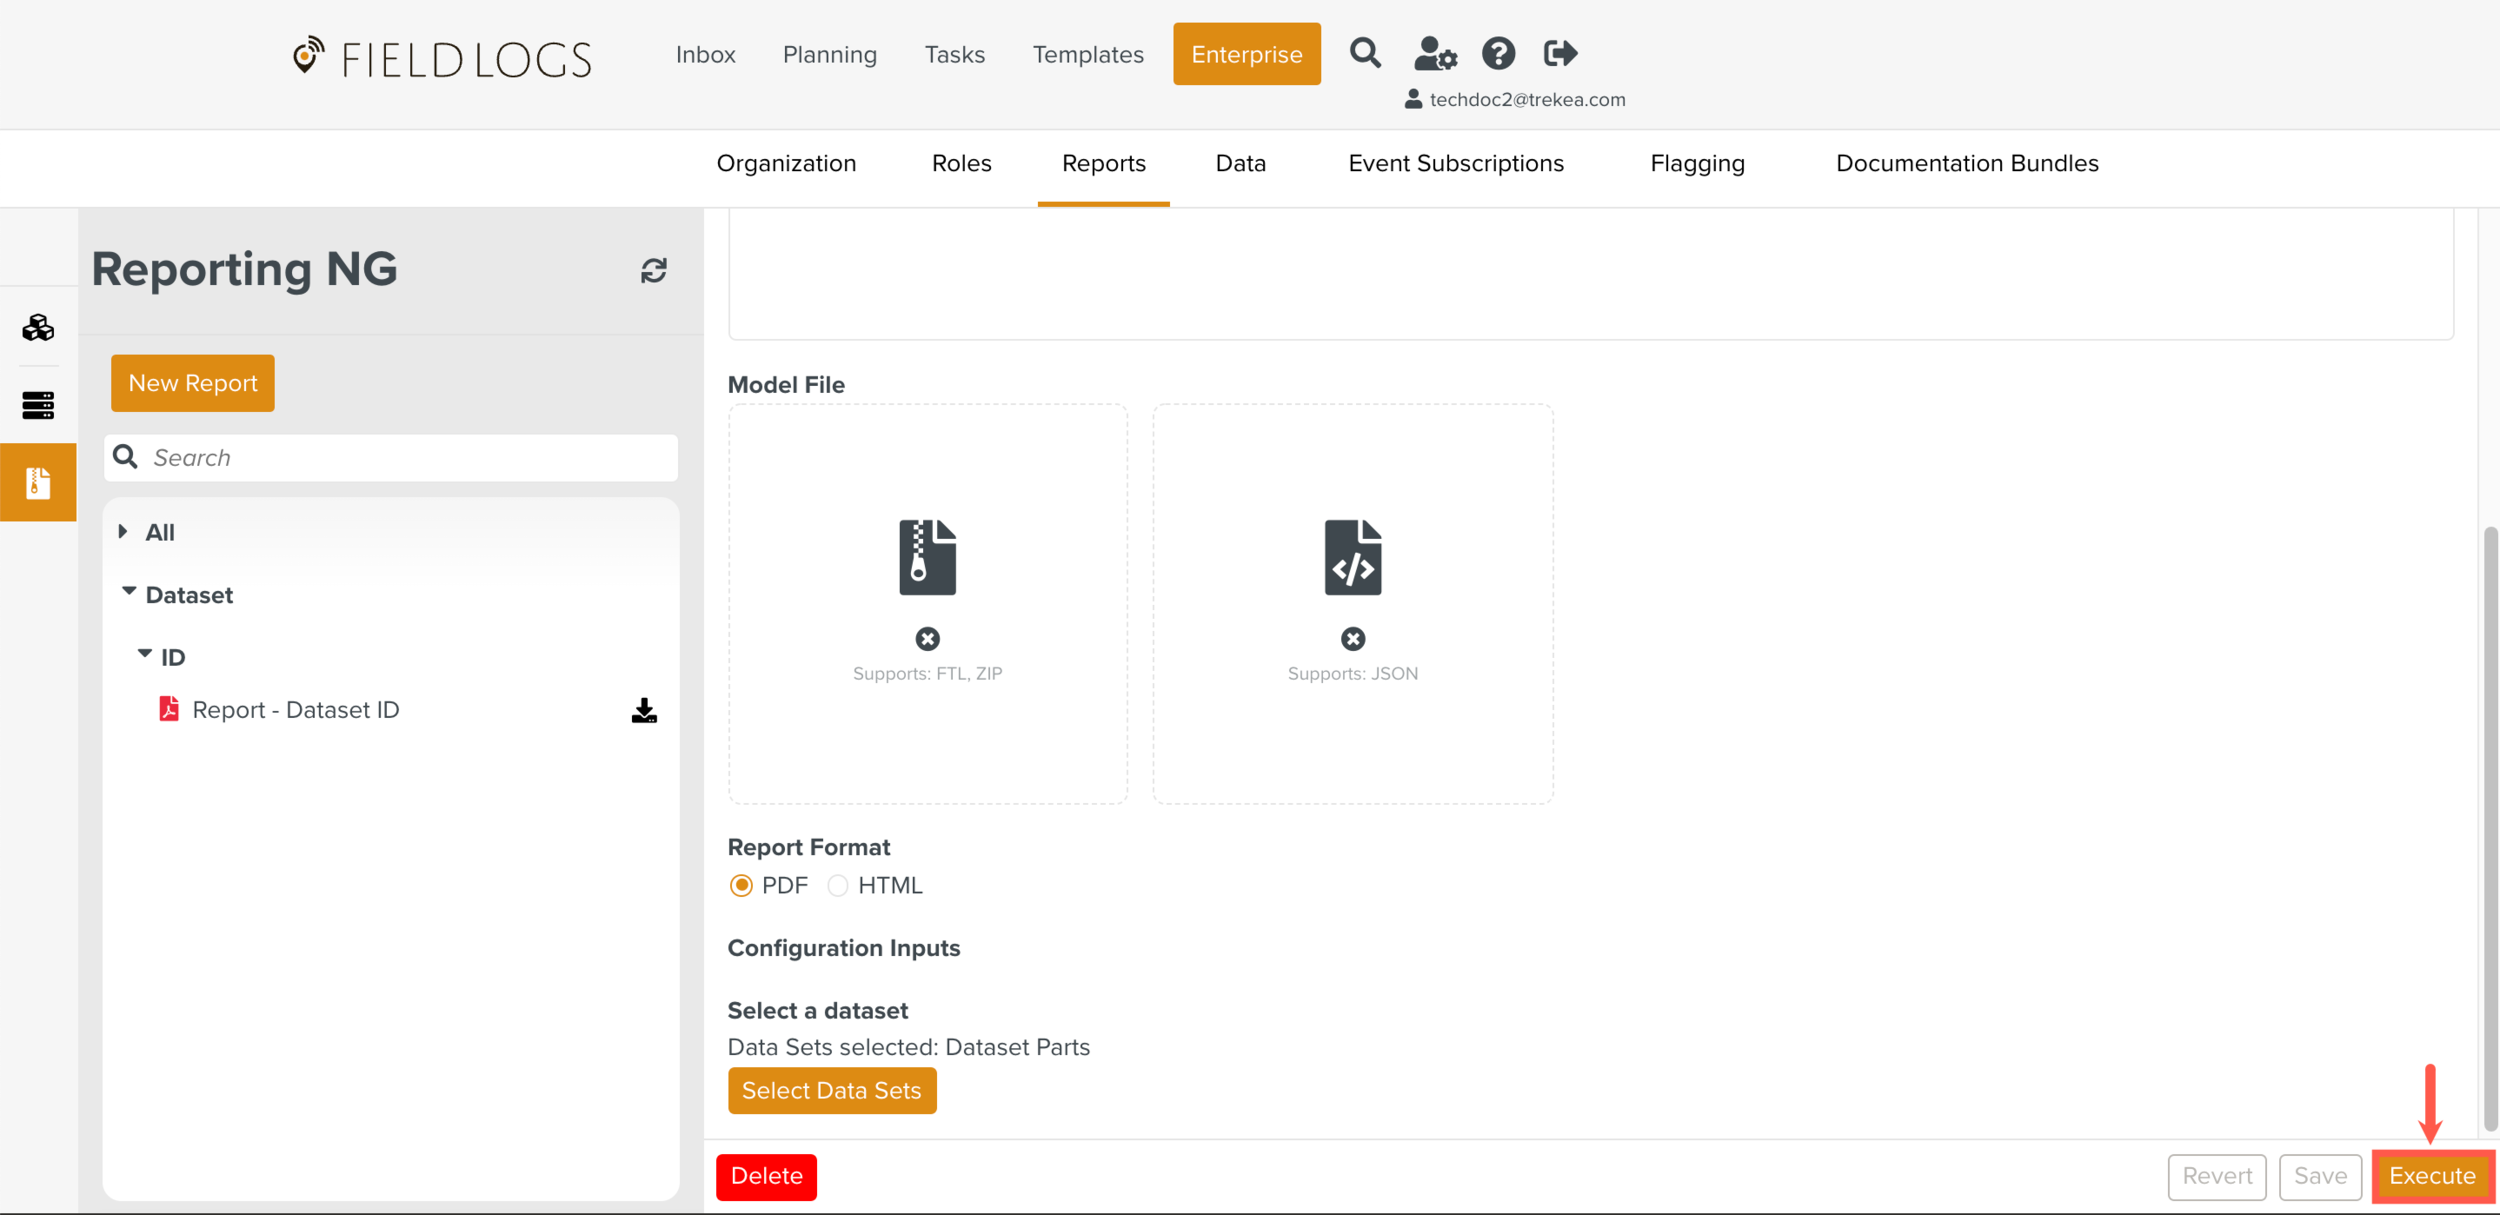
Click . If you selected PDF as the report format, a PDF file is downloaded to your device. If you selected HTML as the report format, the report is downloaded as a HTML file.
Notice the
 icon next to the report name, indicating that the report has been executed. You can click the icon at any time to download the executed report with the latest data.
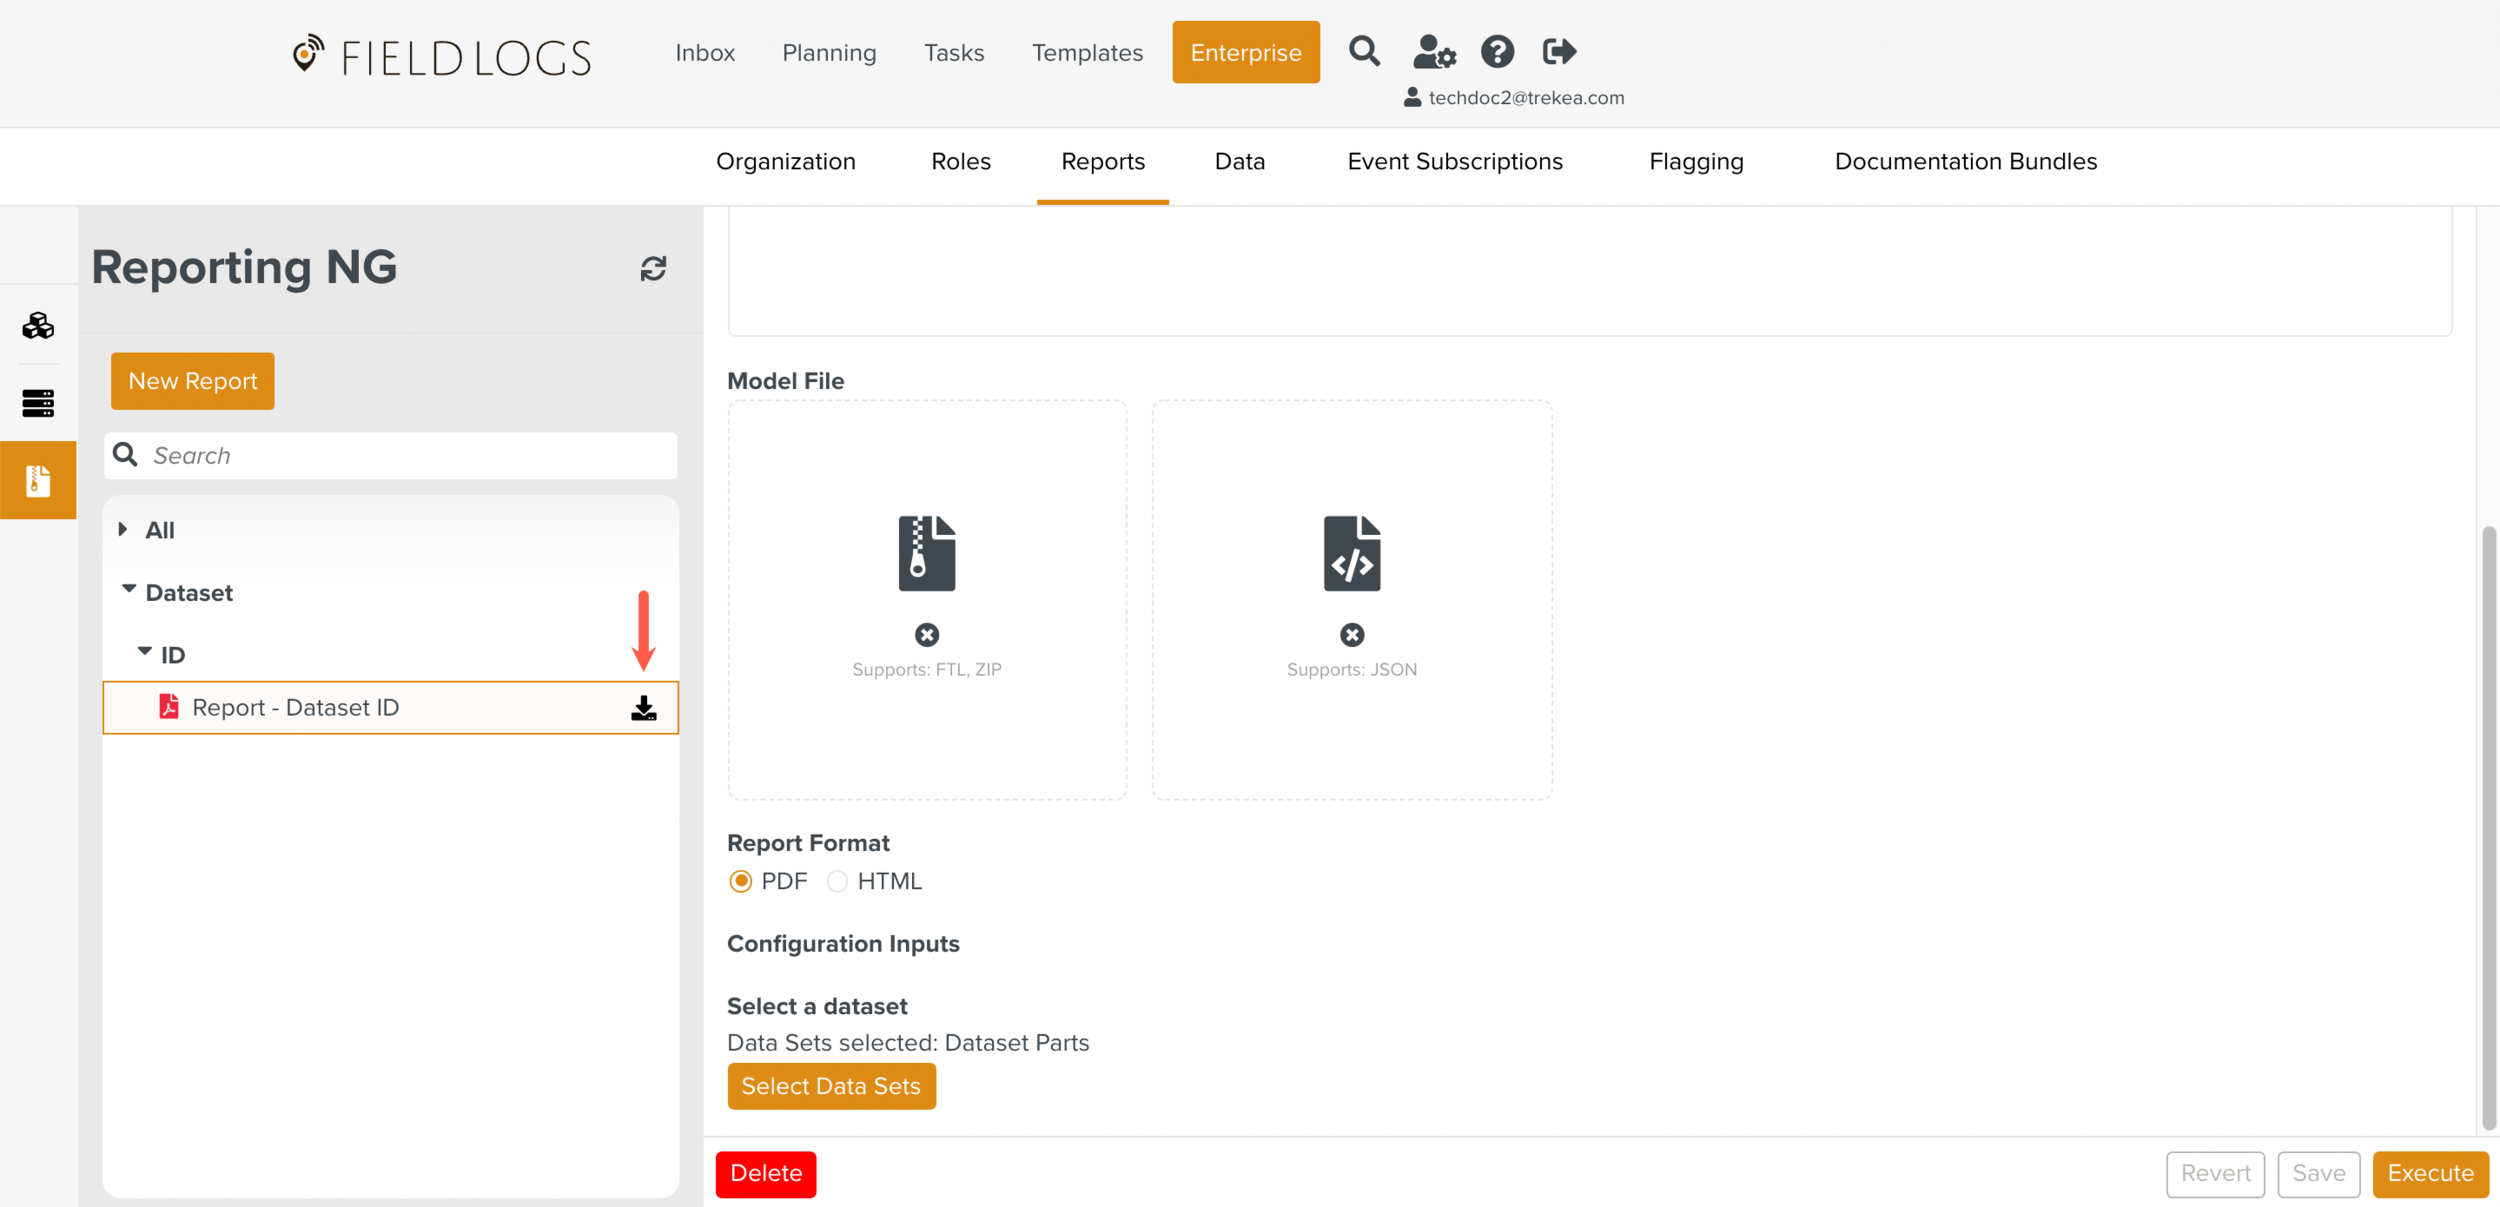
Note
The system processes the generation of reports in Reporting NG as Batch Operations. This is indicated to the user by the following message box that appears when a report is executed.
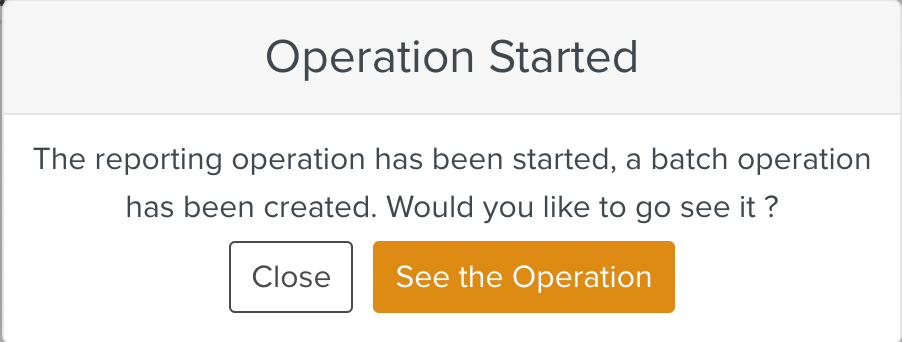 |
If the report generation time is less than 15 seconds, the report gets downloaded automatically. If it is greater than 15 seconds, you can click the button to check the progress of the download.