Screening Dashboard
The  offers an overview of the statuses of all the Screening tasks in your Enterprise.
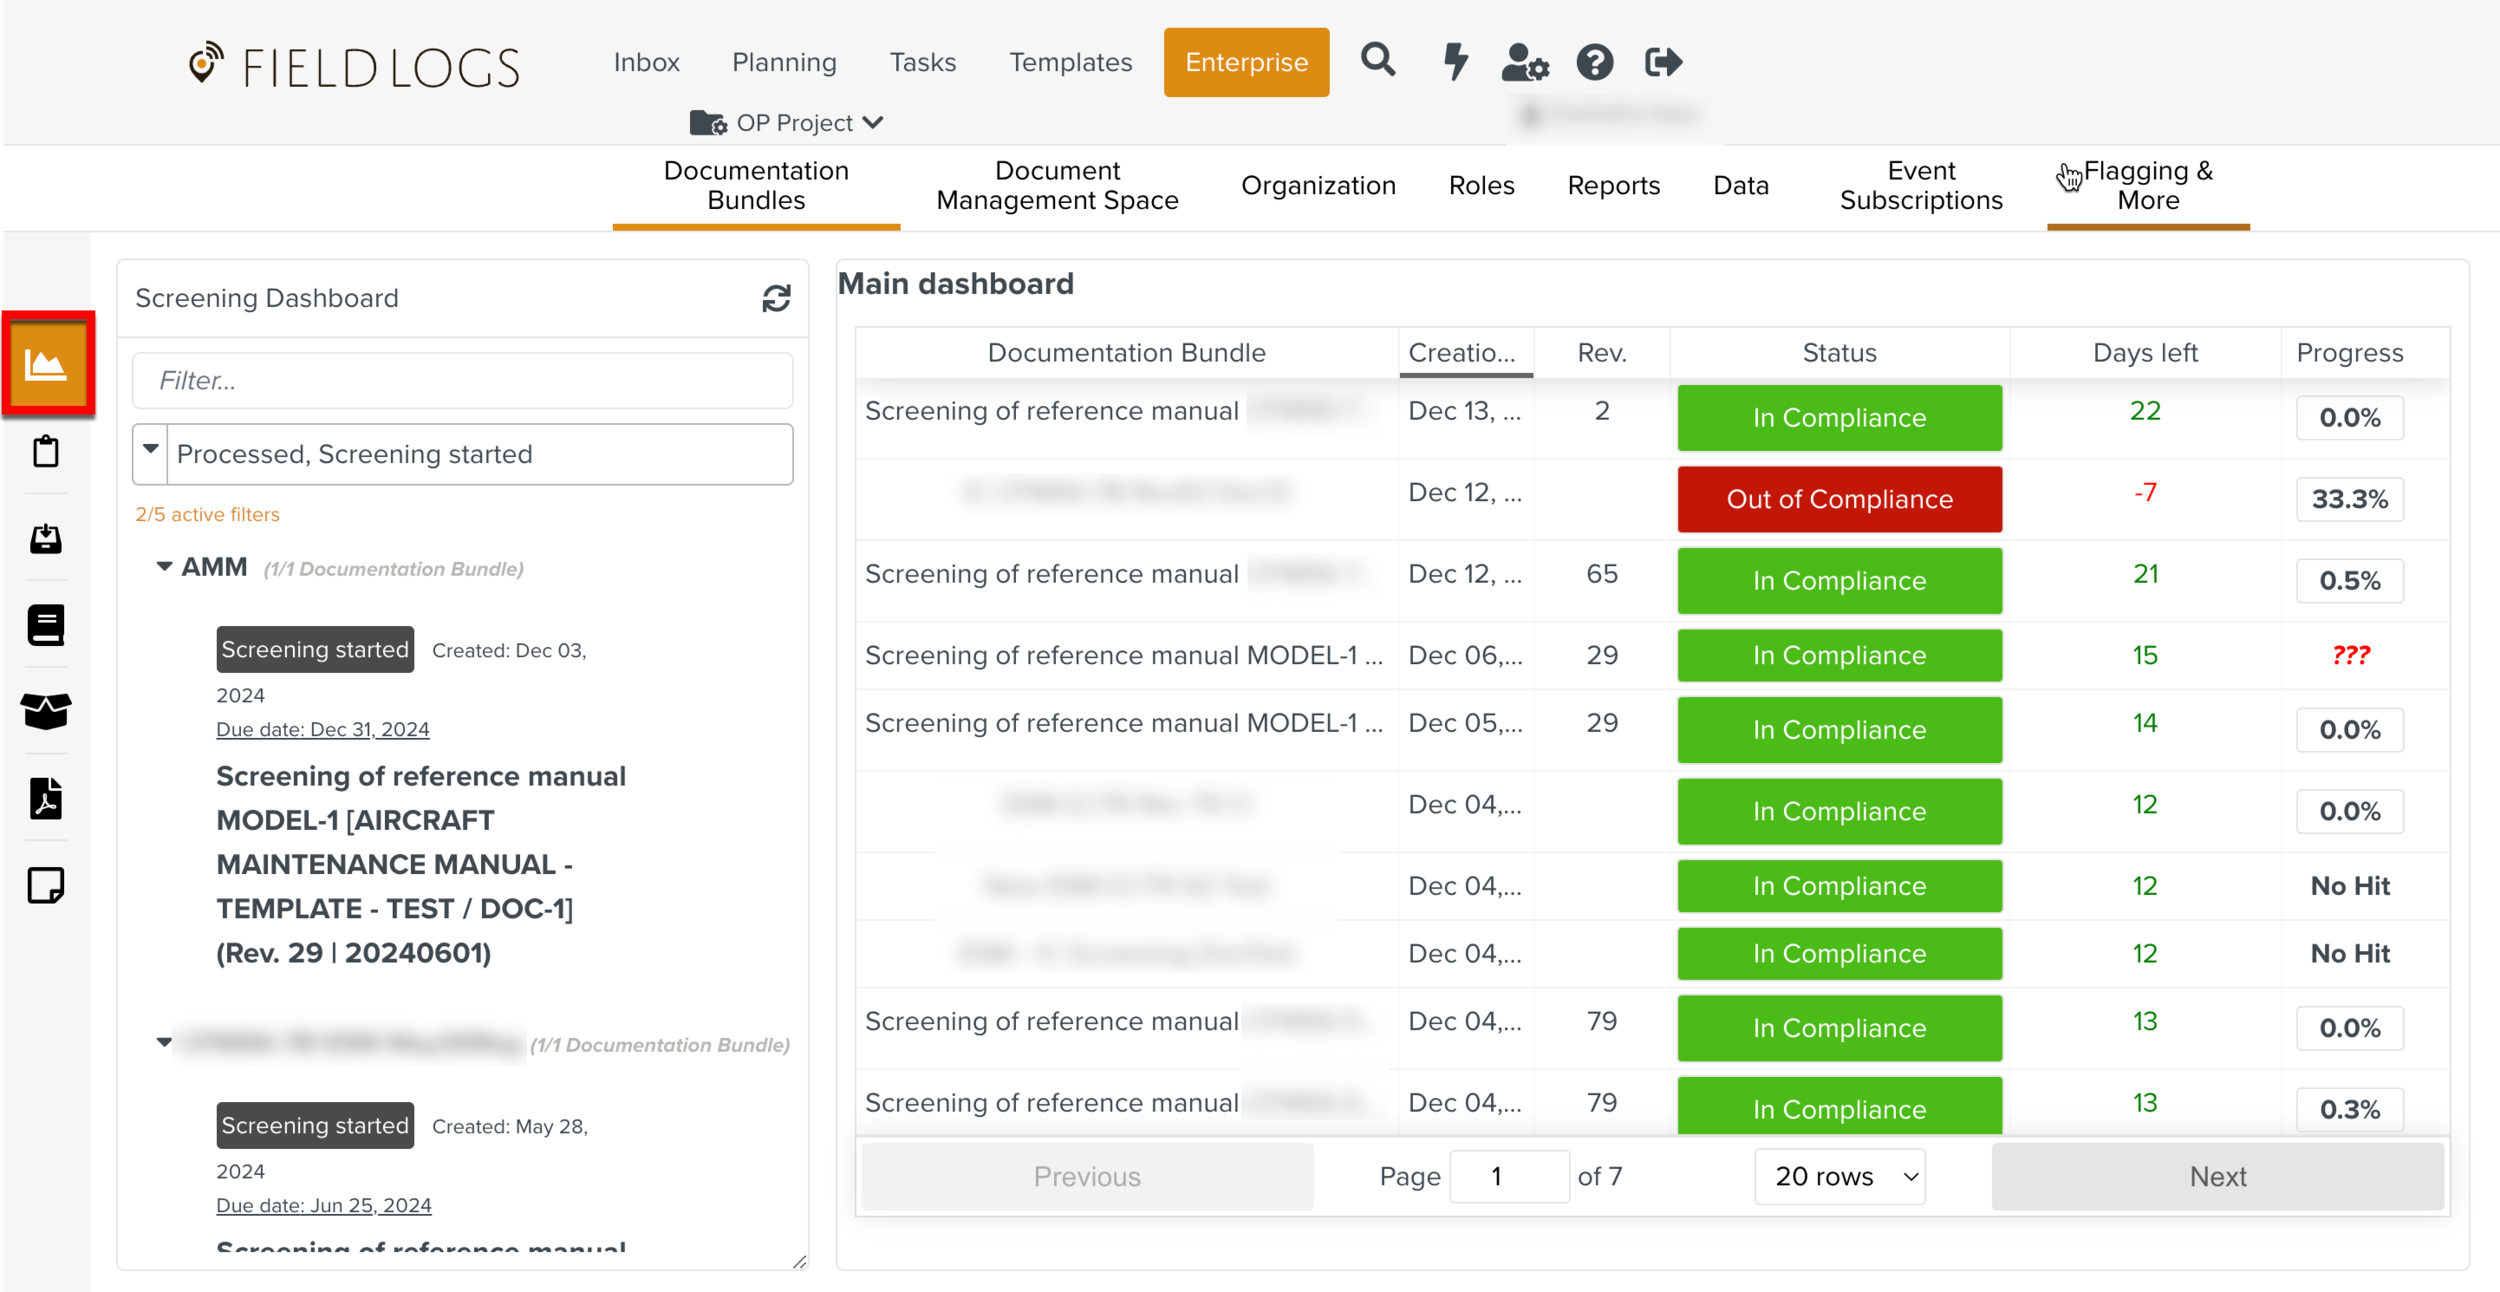
In the left pane of the Screening Dashboard, you can find the list of all the Documentation Bundles grouped under the respective Documentation Types.
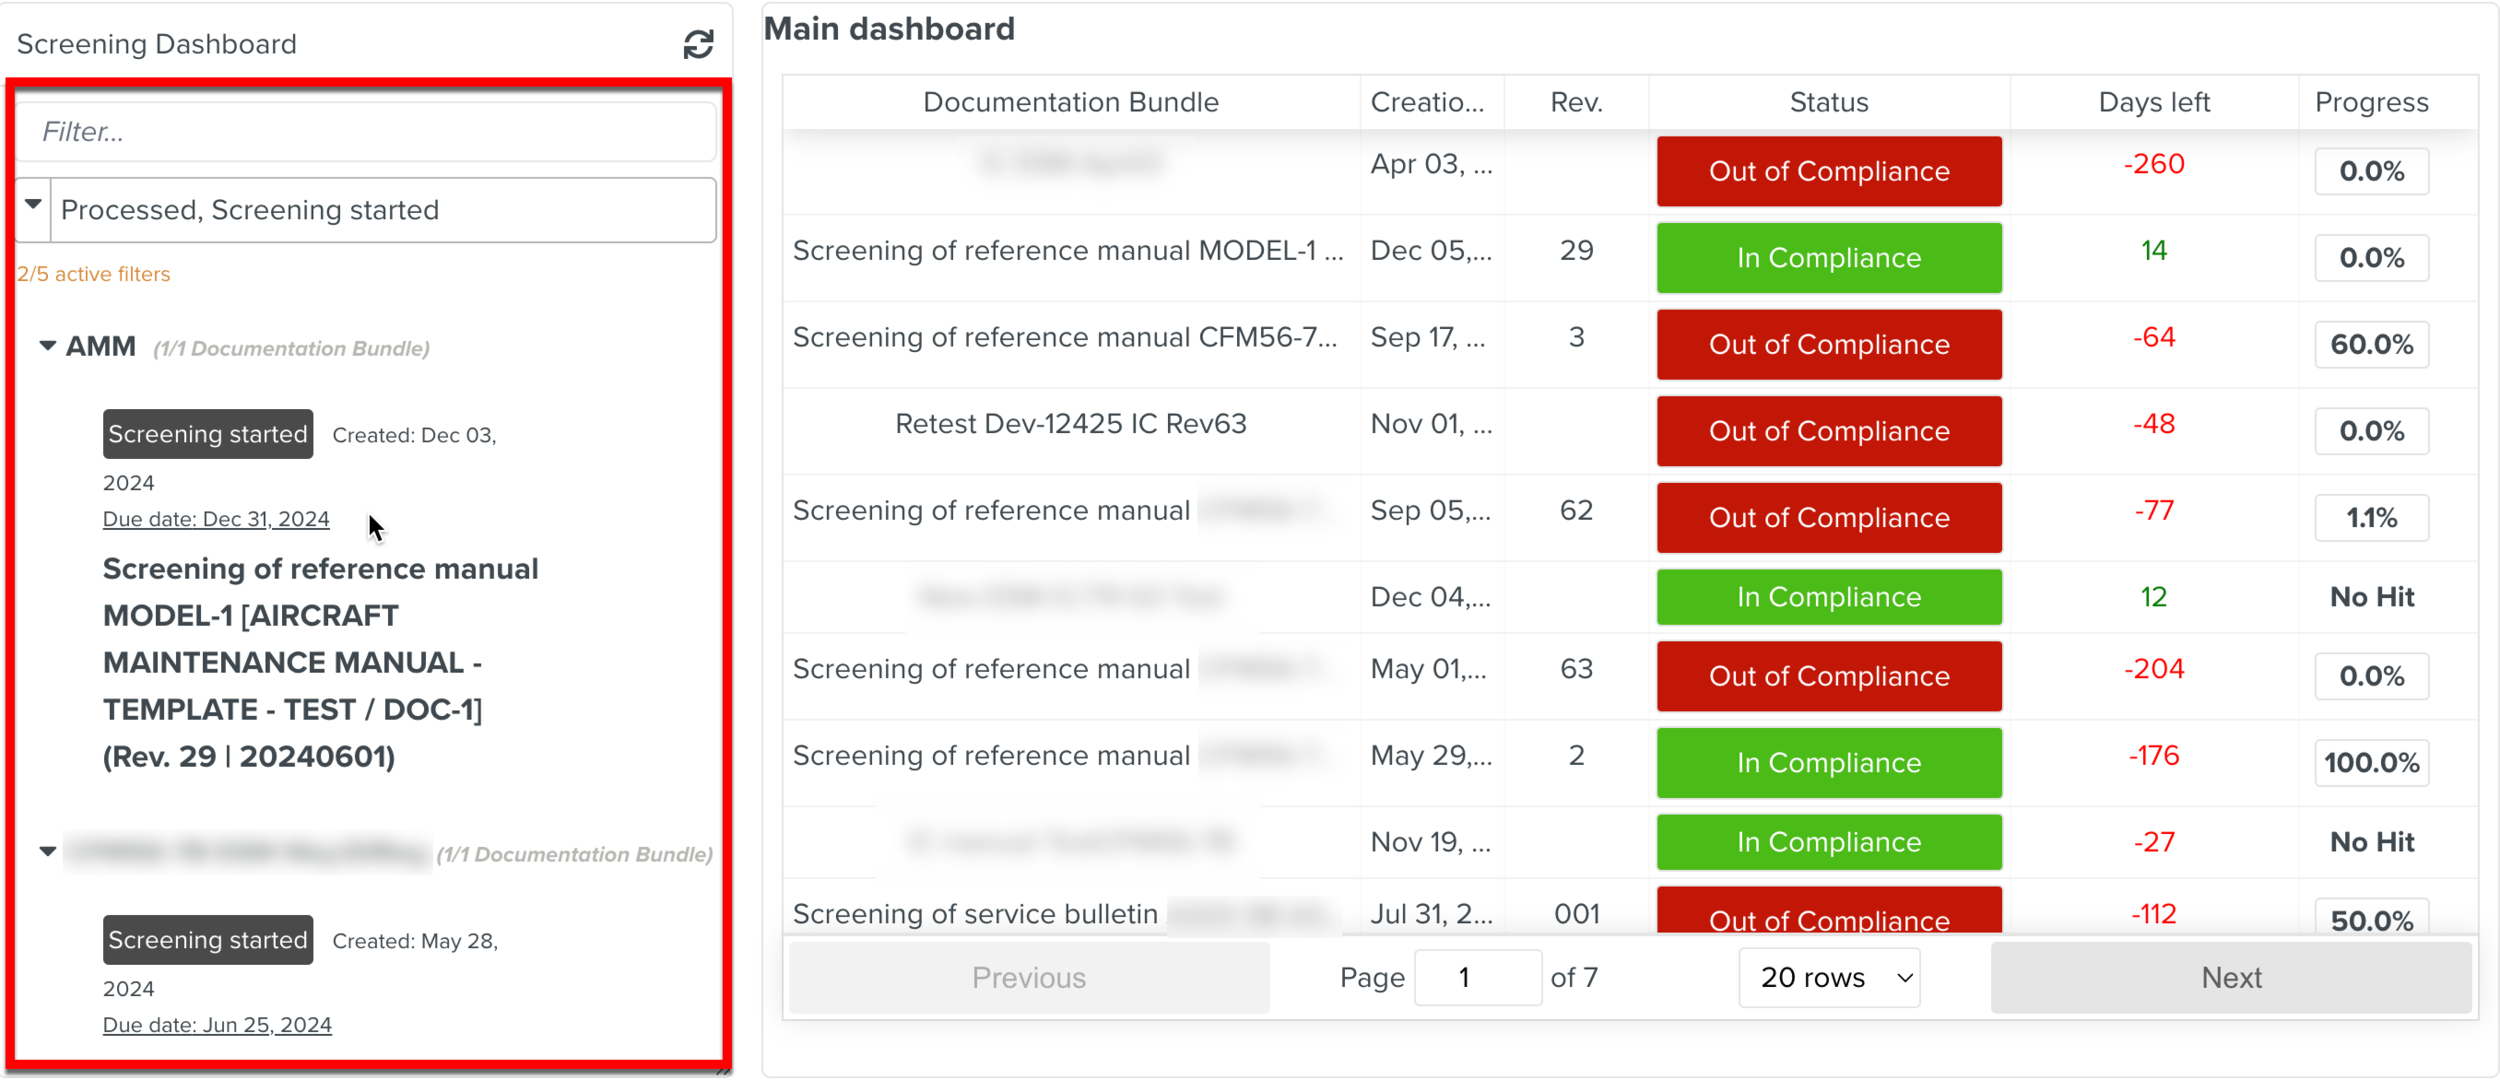 |
The following information about each Documentation Bundle is available on the left pane:
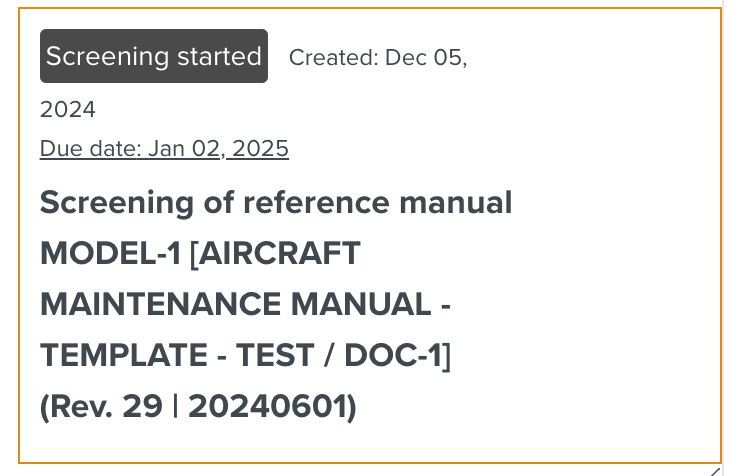 |
The status of the Documentation Bundle
Creation Date
Due Date
The name of the OEM Manual and the revision number.
You can use the below filter to narrow down the Screening tasks based on their statuses:
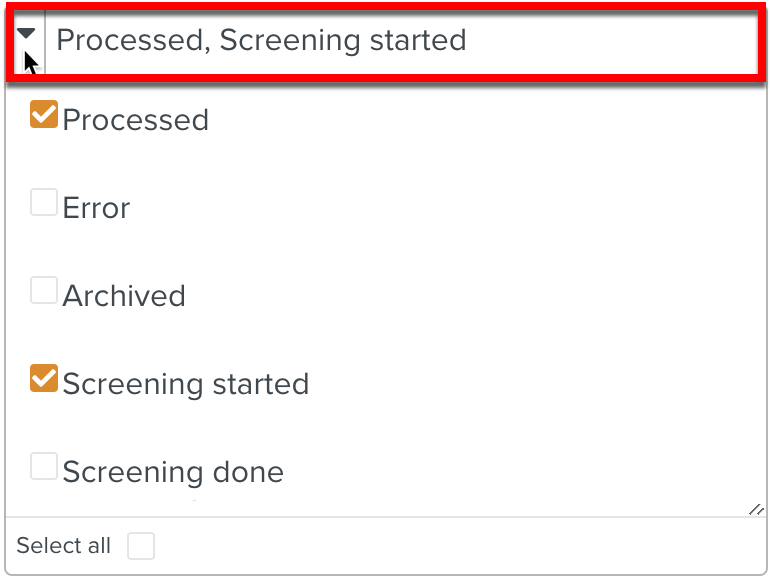 |
Processed
Error
Archived
Screening Started
Screening Done
Viewing the Main Dashboard
The Main Dashboard provides a snapshot of the progress of all the Documentation Bundles.
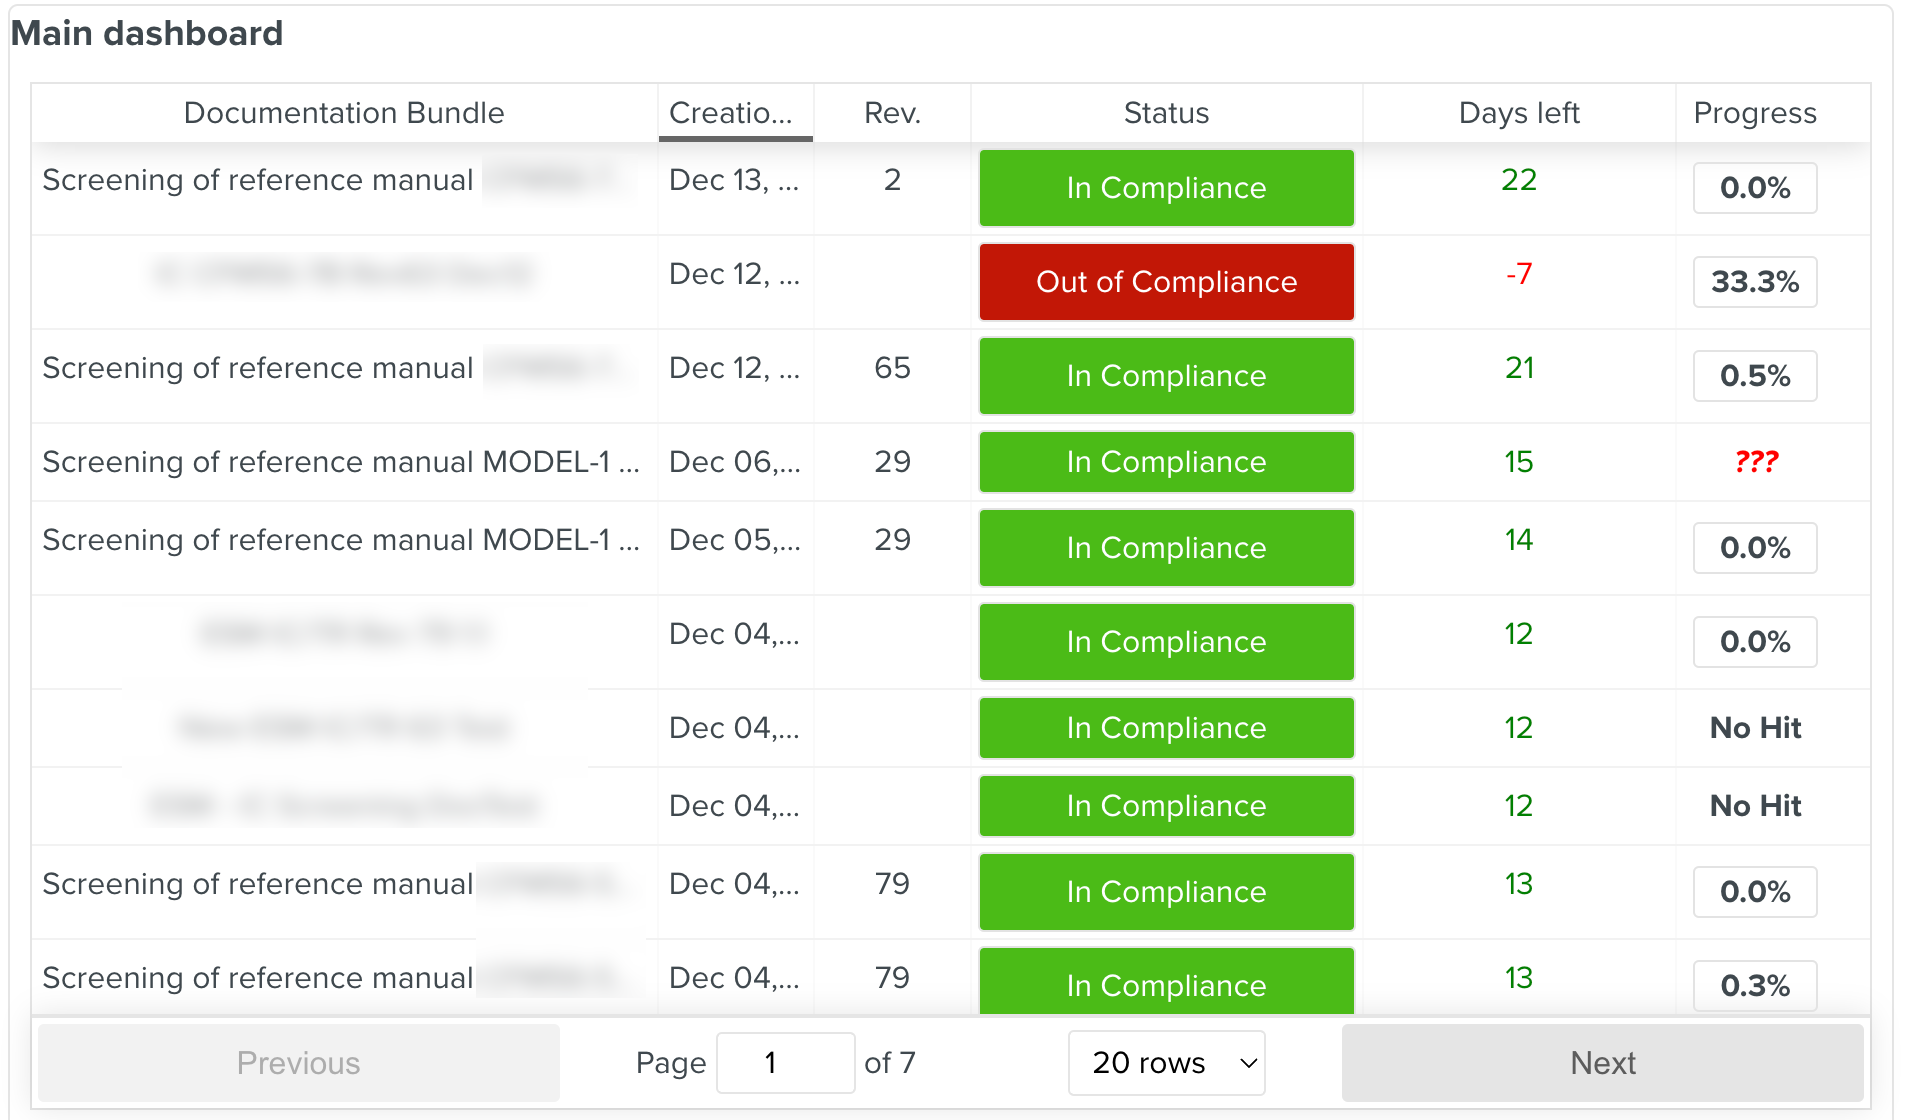 |
You can view the following information pertaining to the Documentation Bundles:
Title | Description | ||
|---|---|---|---|
Documentation Bundle | The name of the Document submitted for Screening. | ||
Creation date | The date of creation of the Documentation Bundle. | ||
Rev. | The Revision number of the manual. | ||
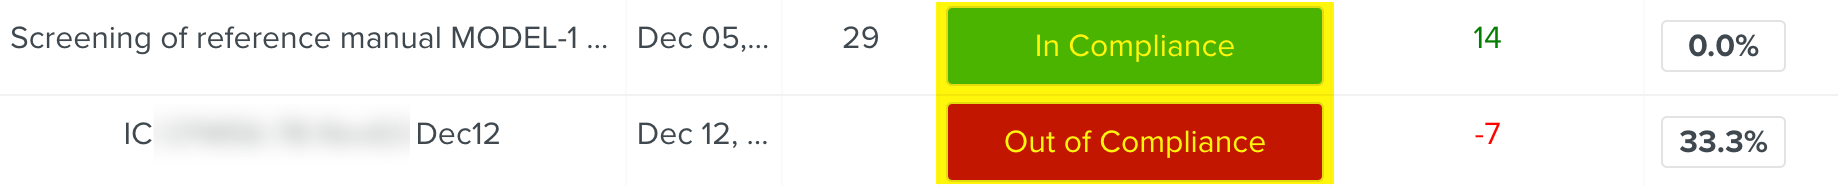
Status | The status of the Screening task can be one of the following:
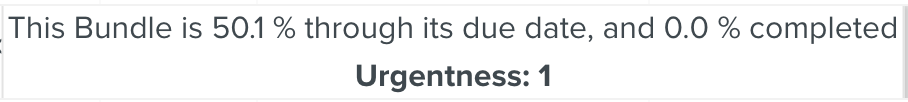
When you hover the mouse over the status, a message appears indicating:
| ||
Days left | Number of days left until the due date. | ||
Progress | The progress of Screening is indicated in percentage. While hovering over the percentage, the number of Hits Screened out of the total number of Hits is displayed. |
Viewing the Individual Progress
The progress of each Documentation Bundle can be tracked in the Screening Dashboard. When you select a Documentation Bundle, the Screening progress is presented in the form of a pie chart along with the other details.
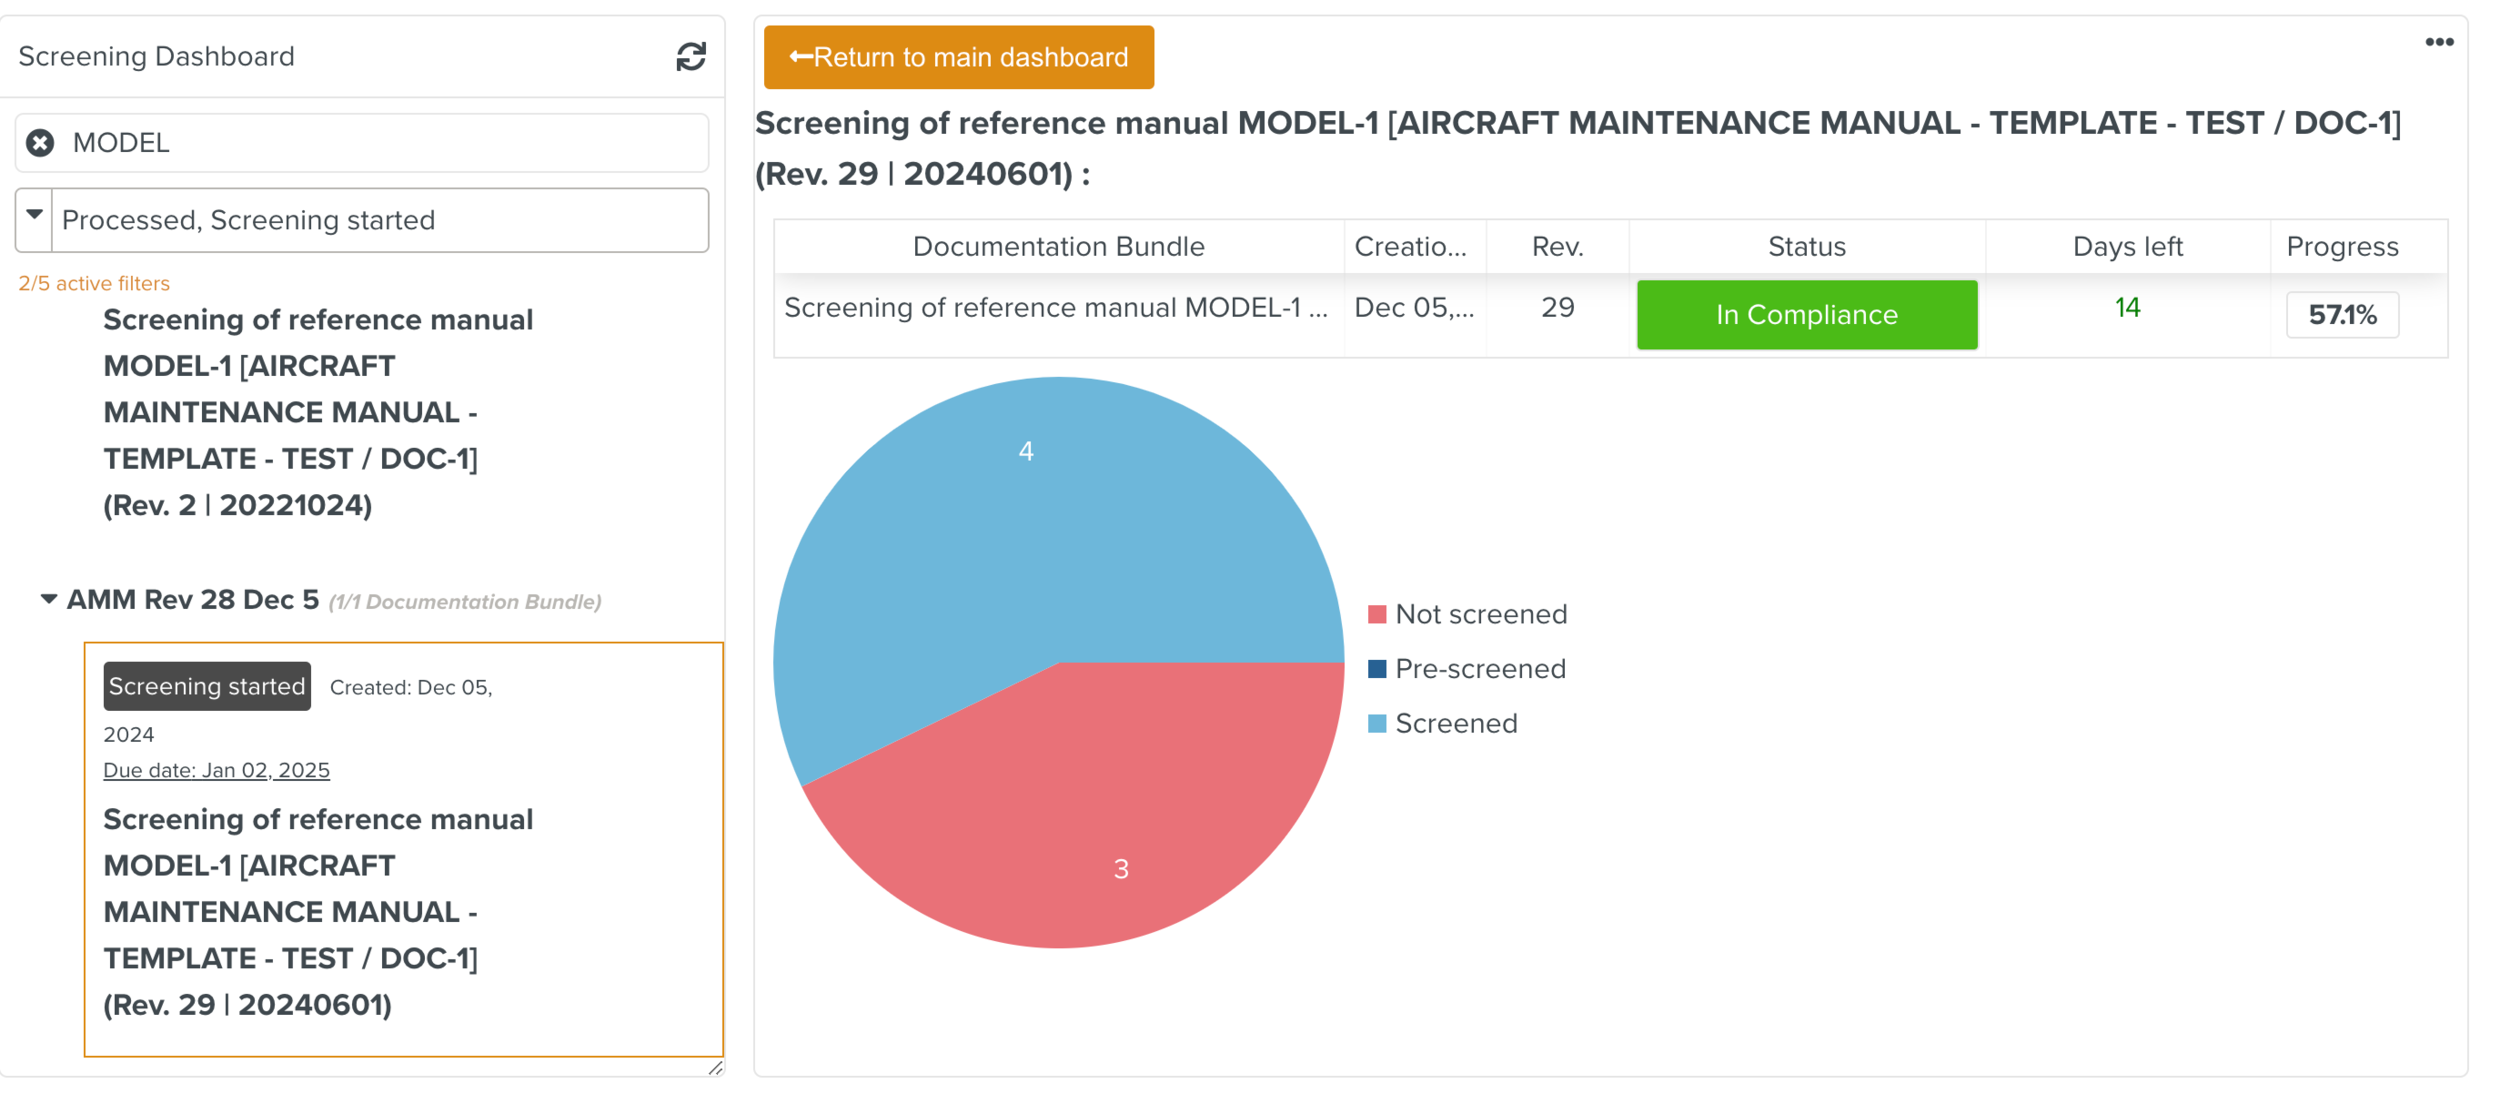 |
The different color segments represent the following information about the progress:
Colour | Description |
|---|---|
Red | The red segment indicates Not Screened category. It displays the total number of Hits that are not Screened. |
Navy Blue | The navy blue segment indicates Pre Screened category. It displays the total number of Pre-Screened Hits. |
Blue | The blue segment indicates Screened category. It displays the total number of Screened Hits. |