Activating an Operation Plan
After the instance of an Operation Plan is created, it has to be activated to start responding to that occur in the system.
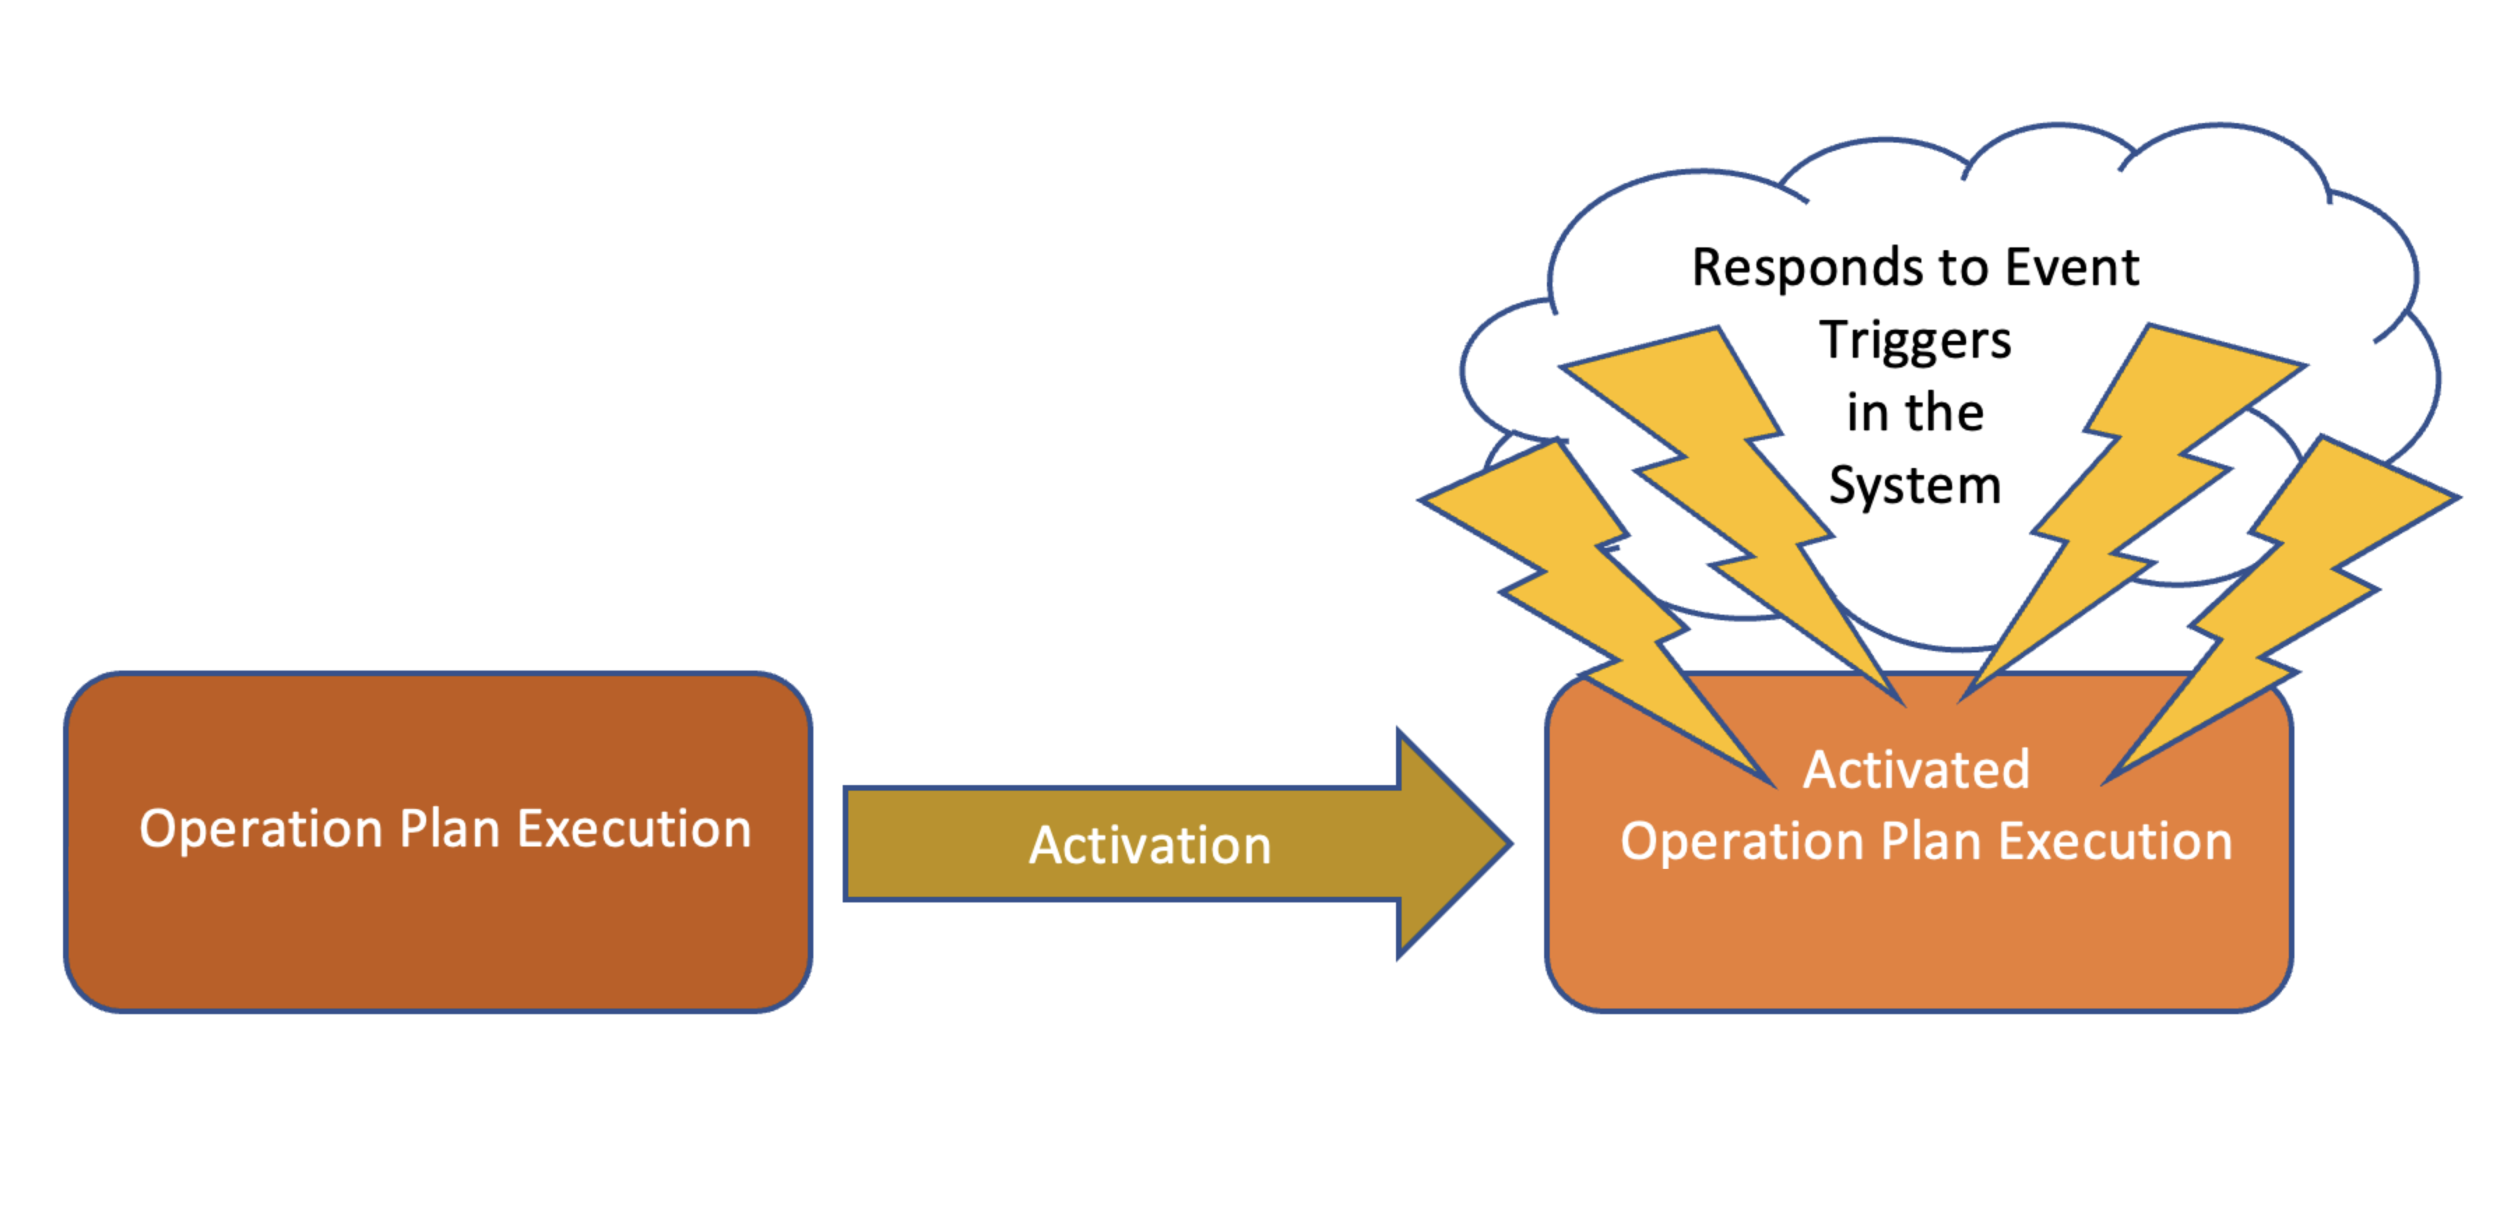 |
To activate an Operation Plan:
From the main menu, navigate to > > as shown.
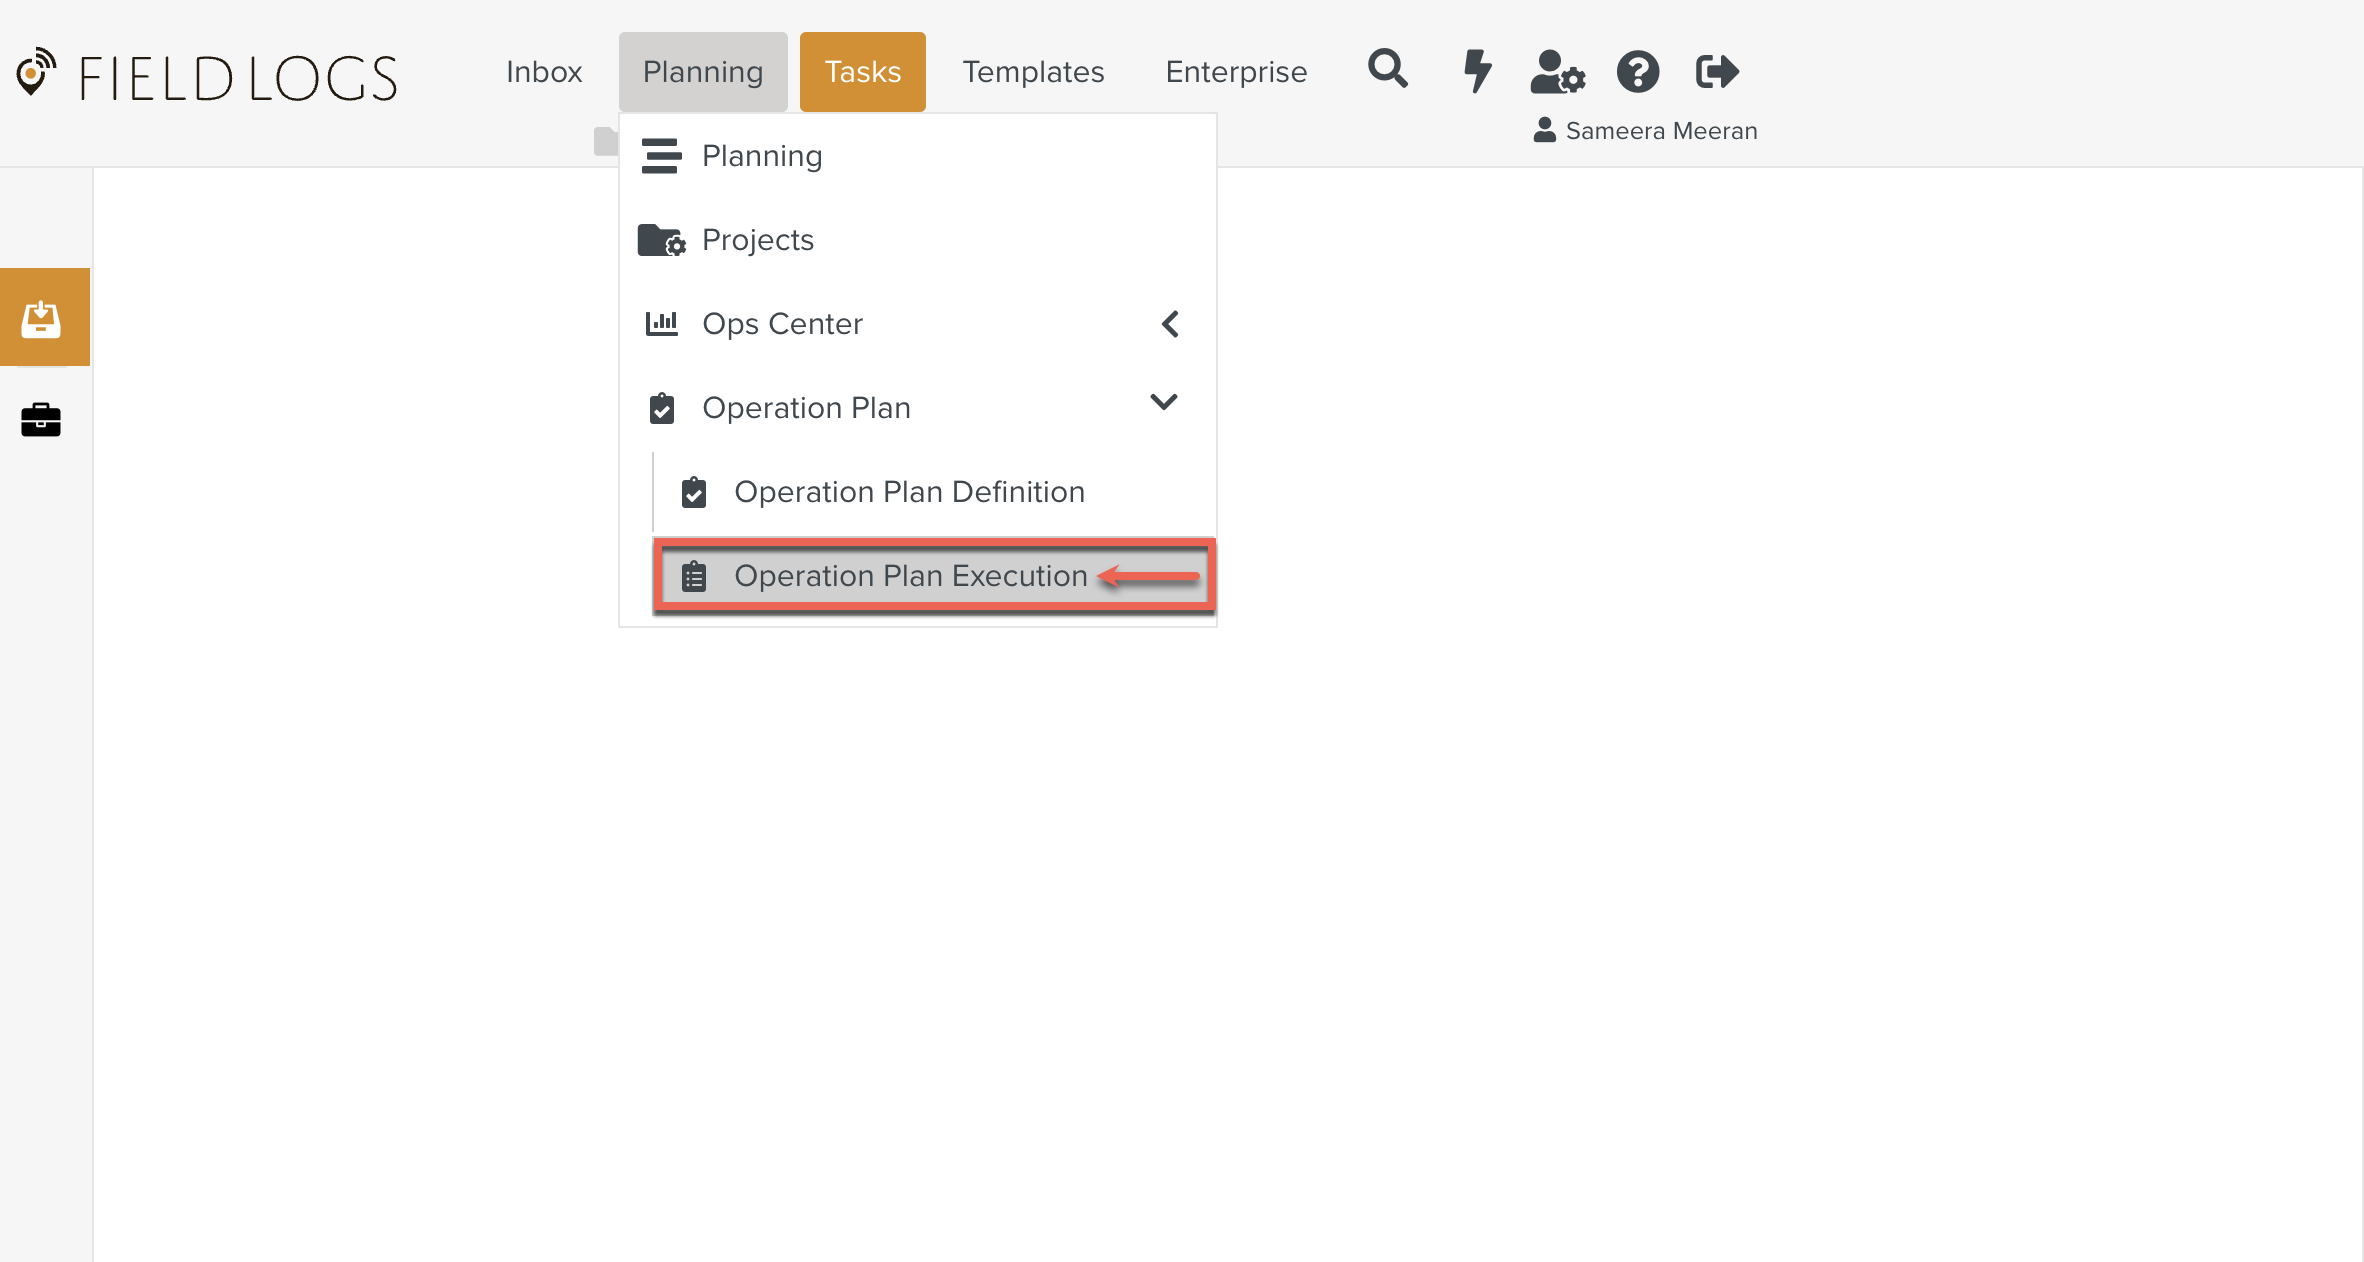
The tab opens. You can see the list of existing Operation Plan Executions.
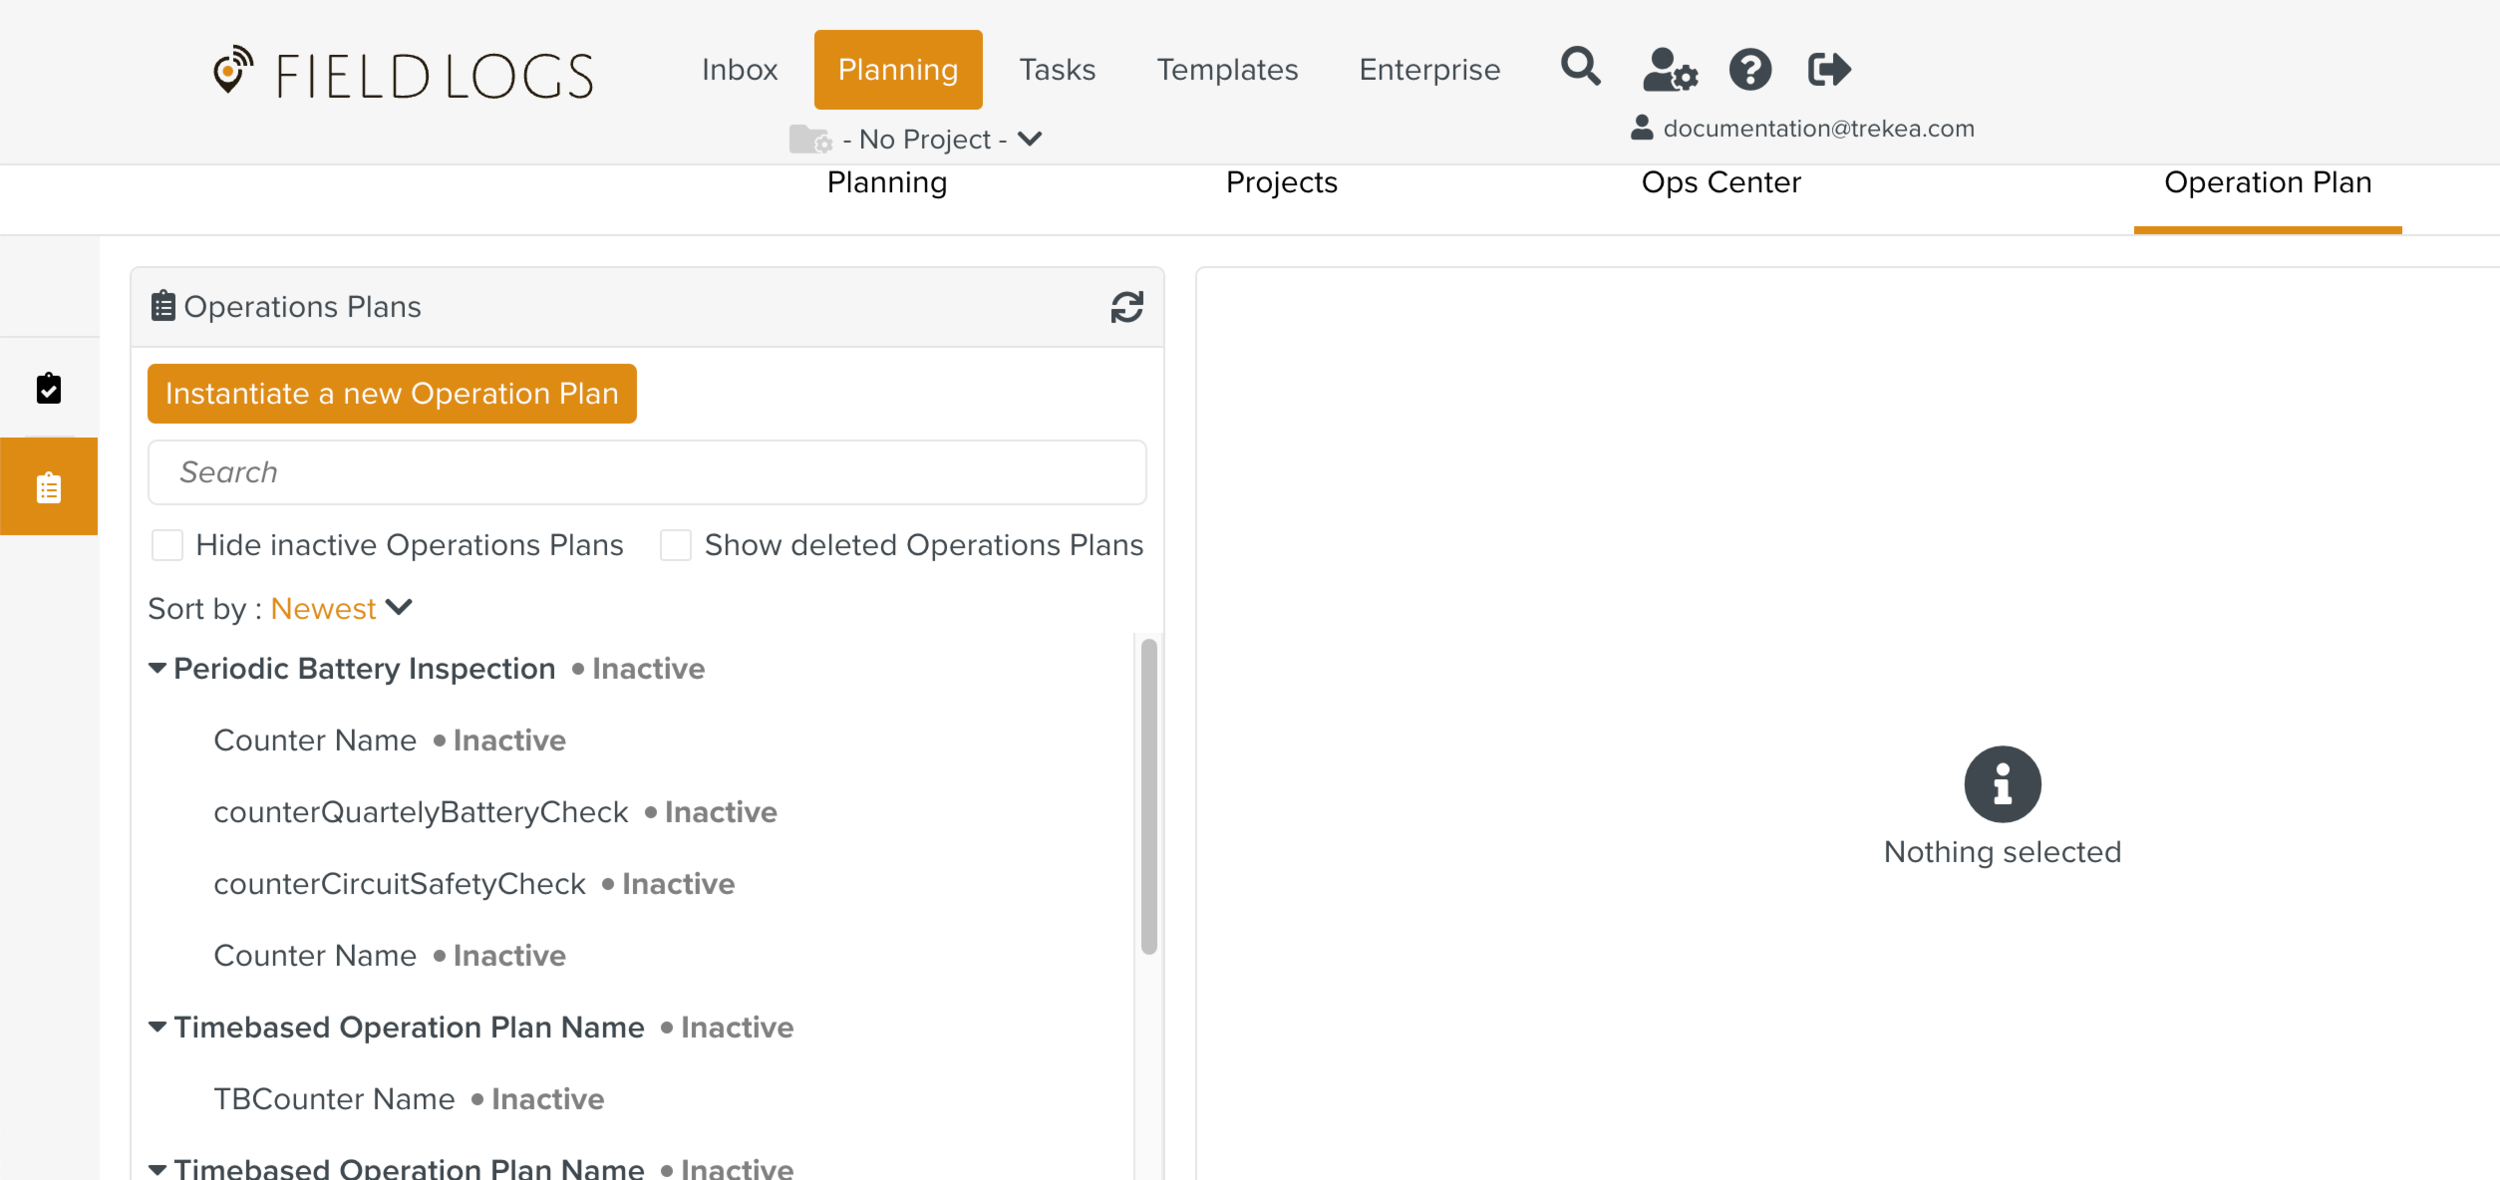
Select the Operation Plan Execution instance that needs to be activated. The details of the Operation Plan Execution appears.
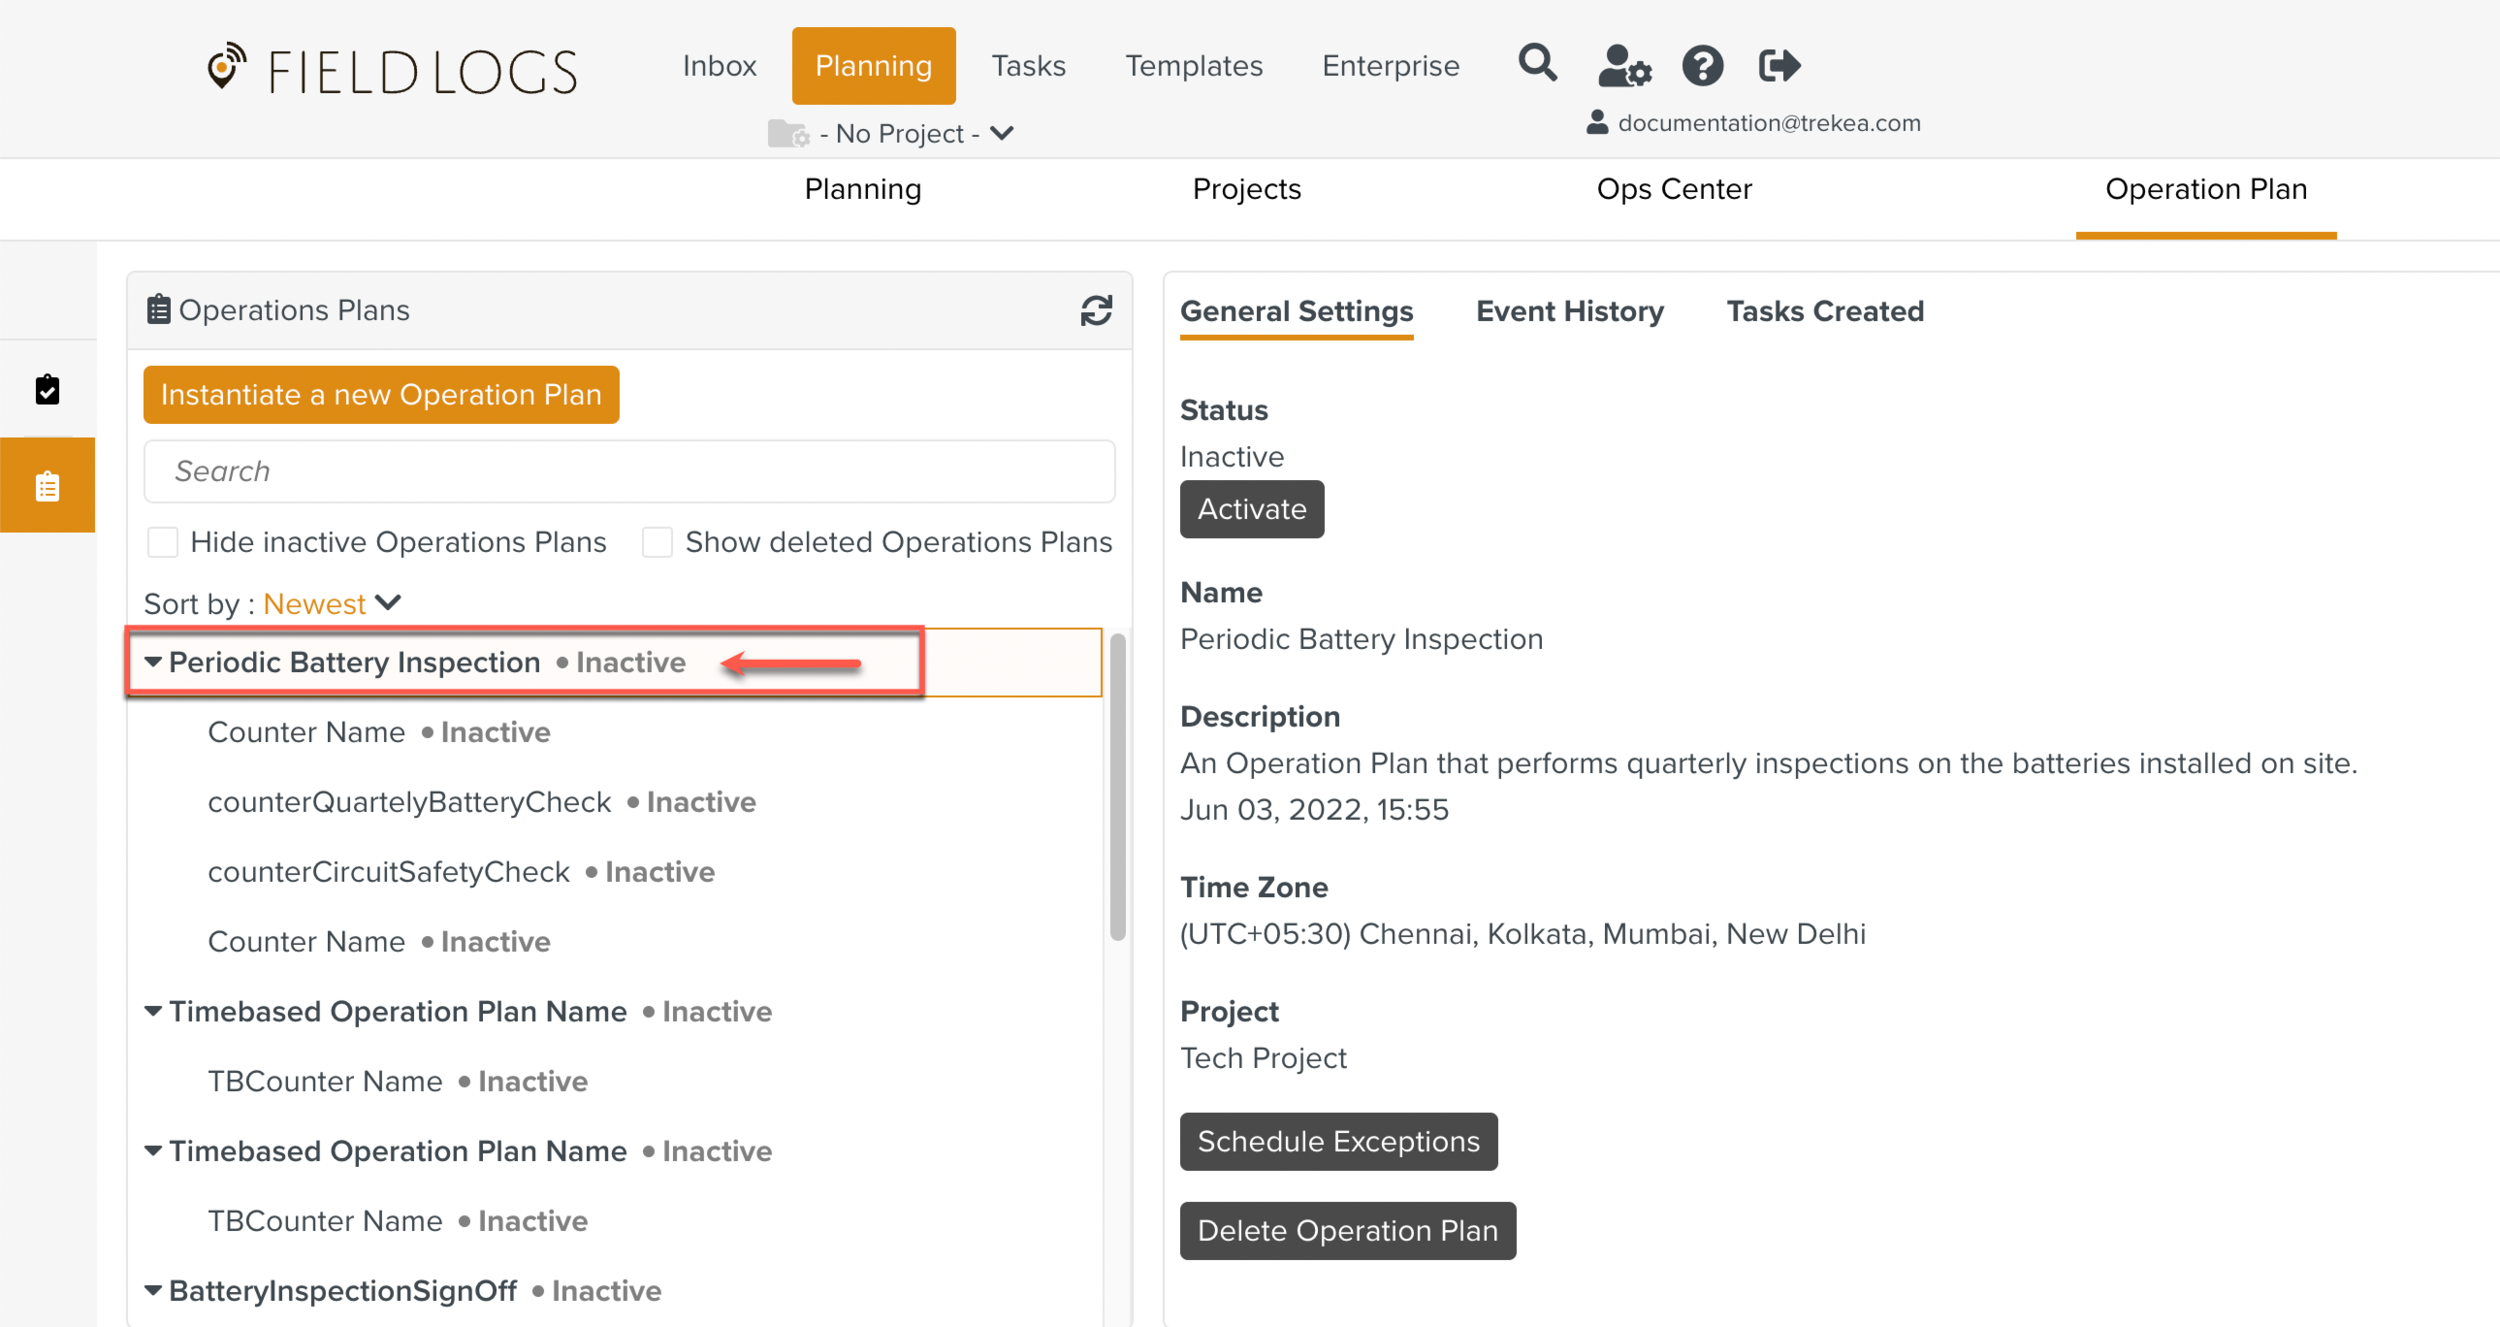
In the tab, click .
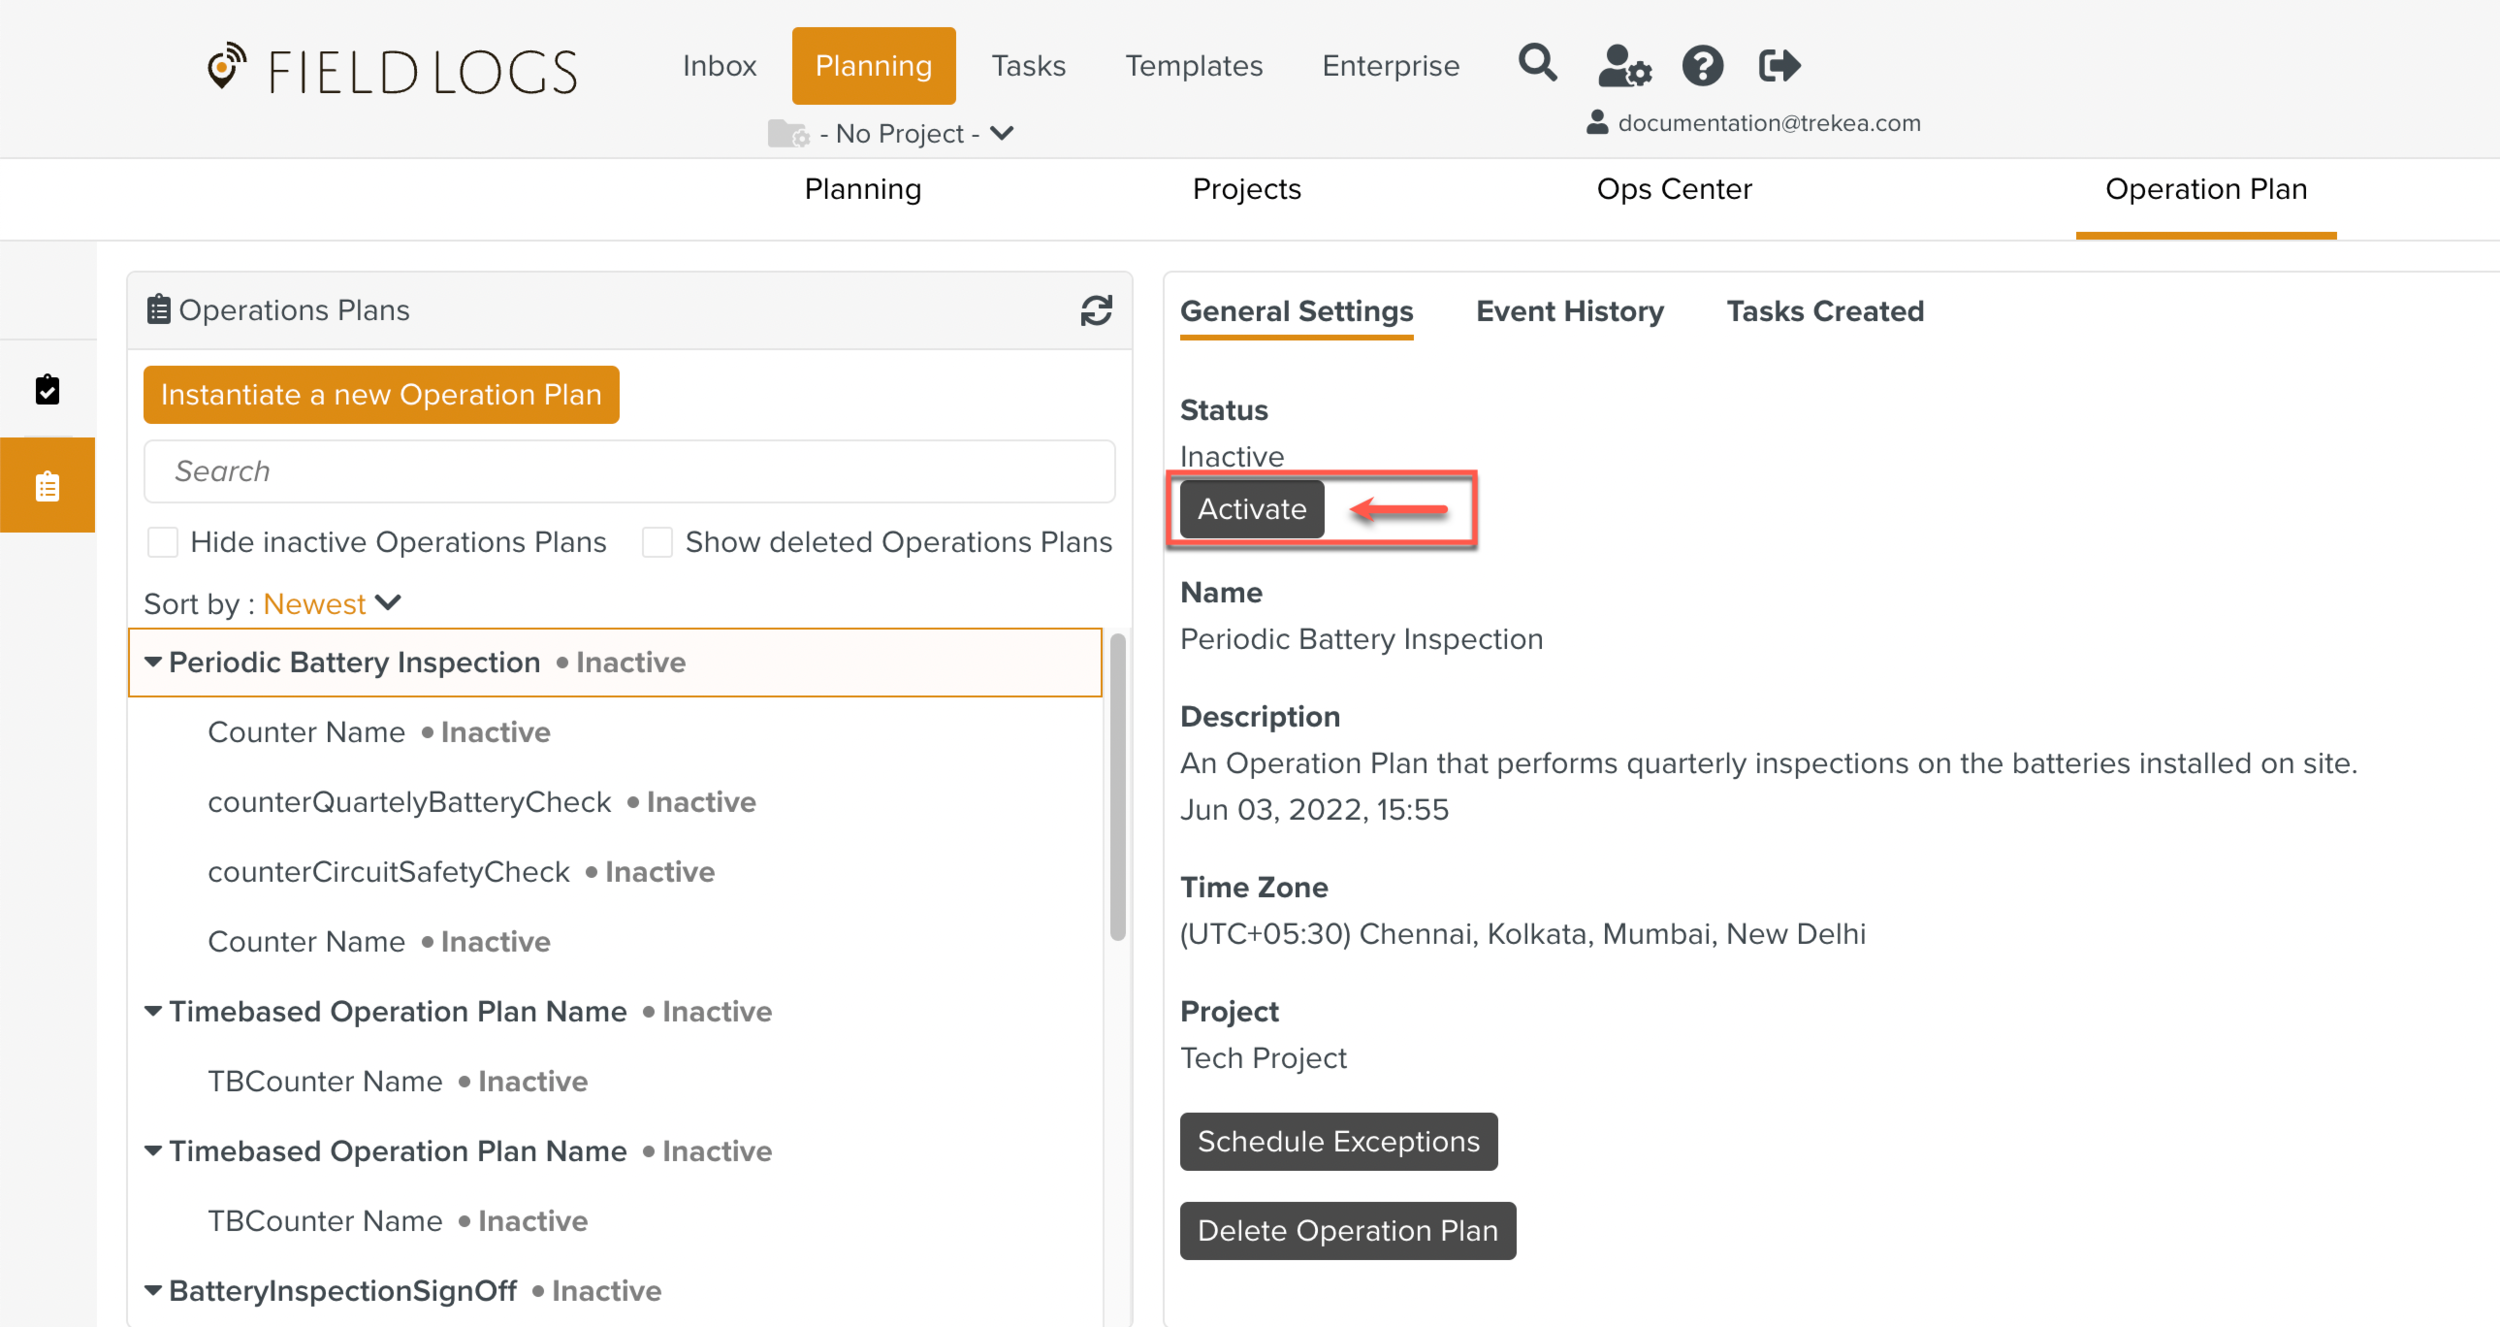
The Operation Plan Execution is activated. By default, this activates all the Counters within the Operation Plan Execution.
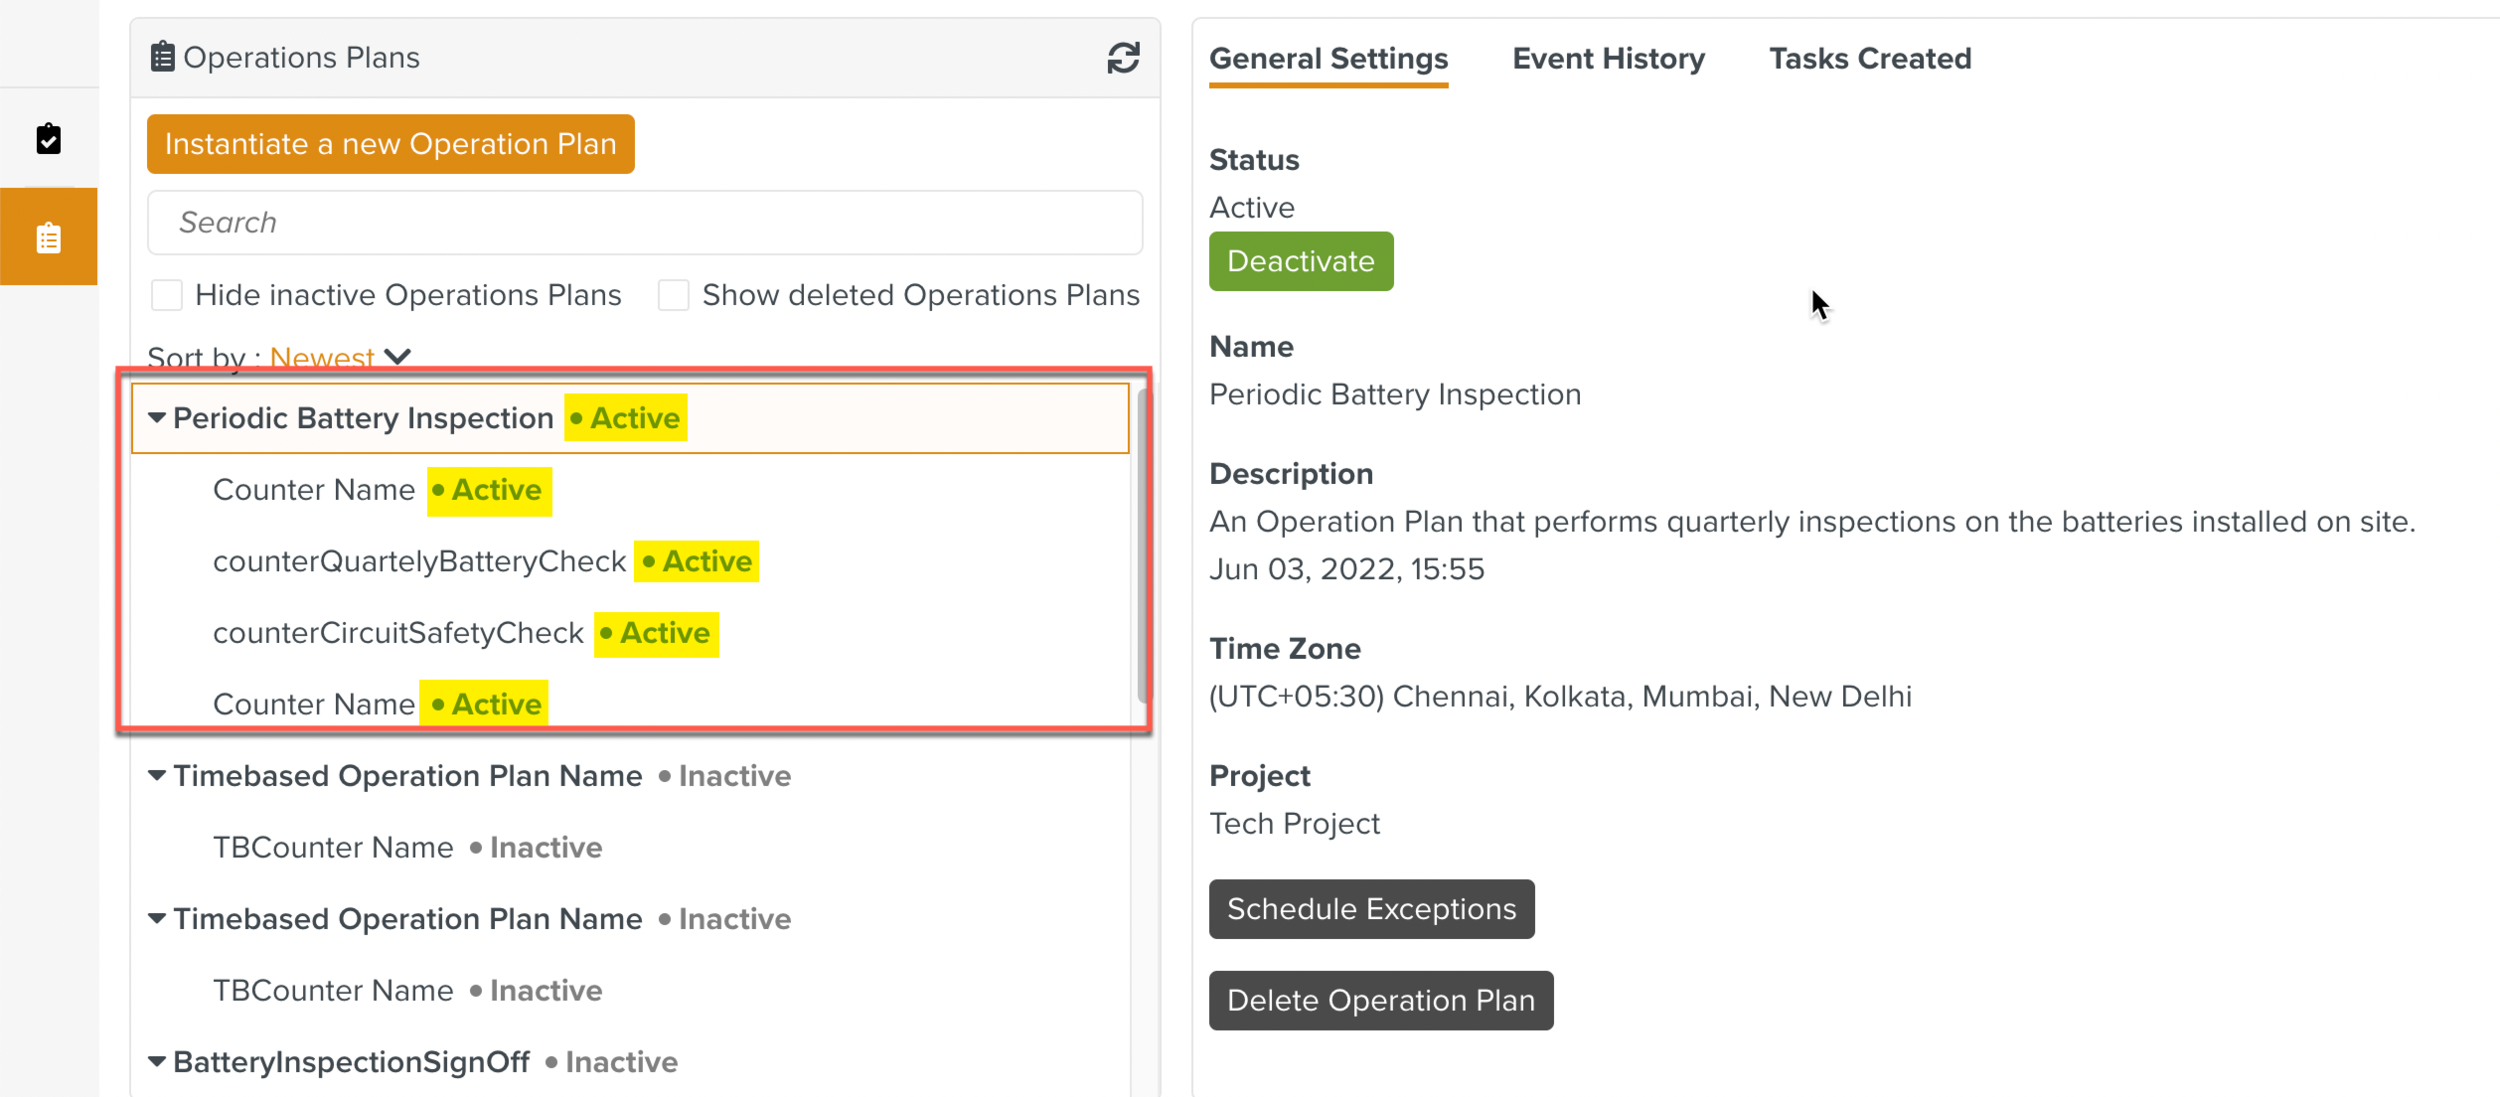
You can deactivate some Counters in the Operation Plan Execution, if required.
To deactivate a Counter in an Active Operation Plan:
Select the Counter to be deactivated. Click .
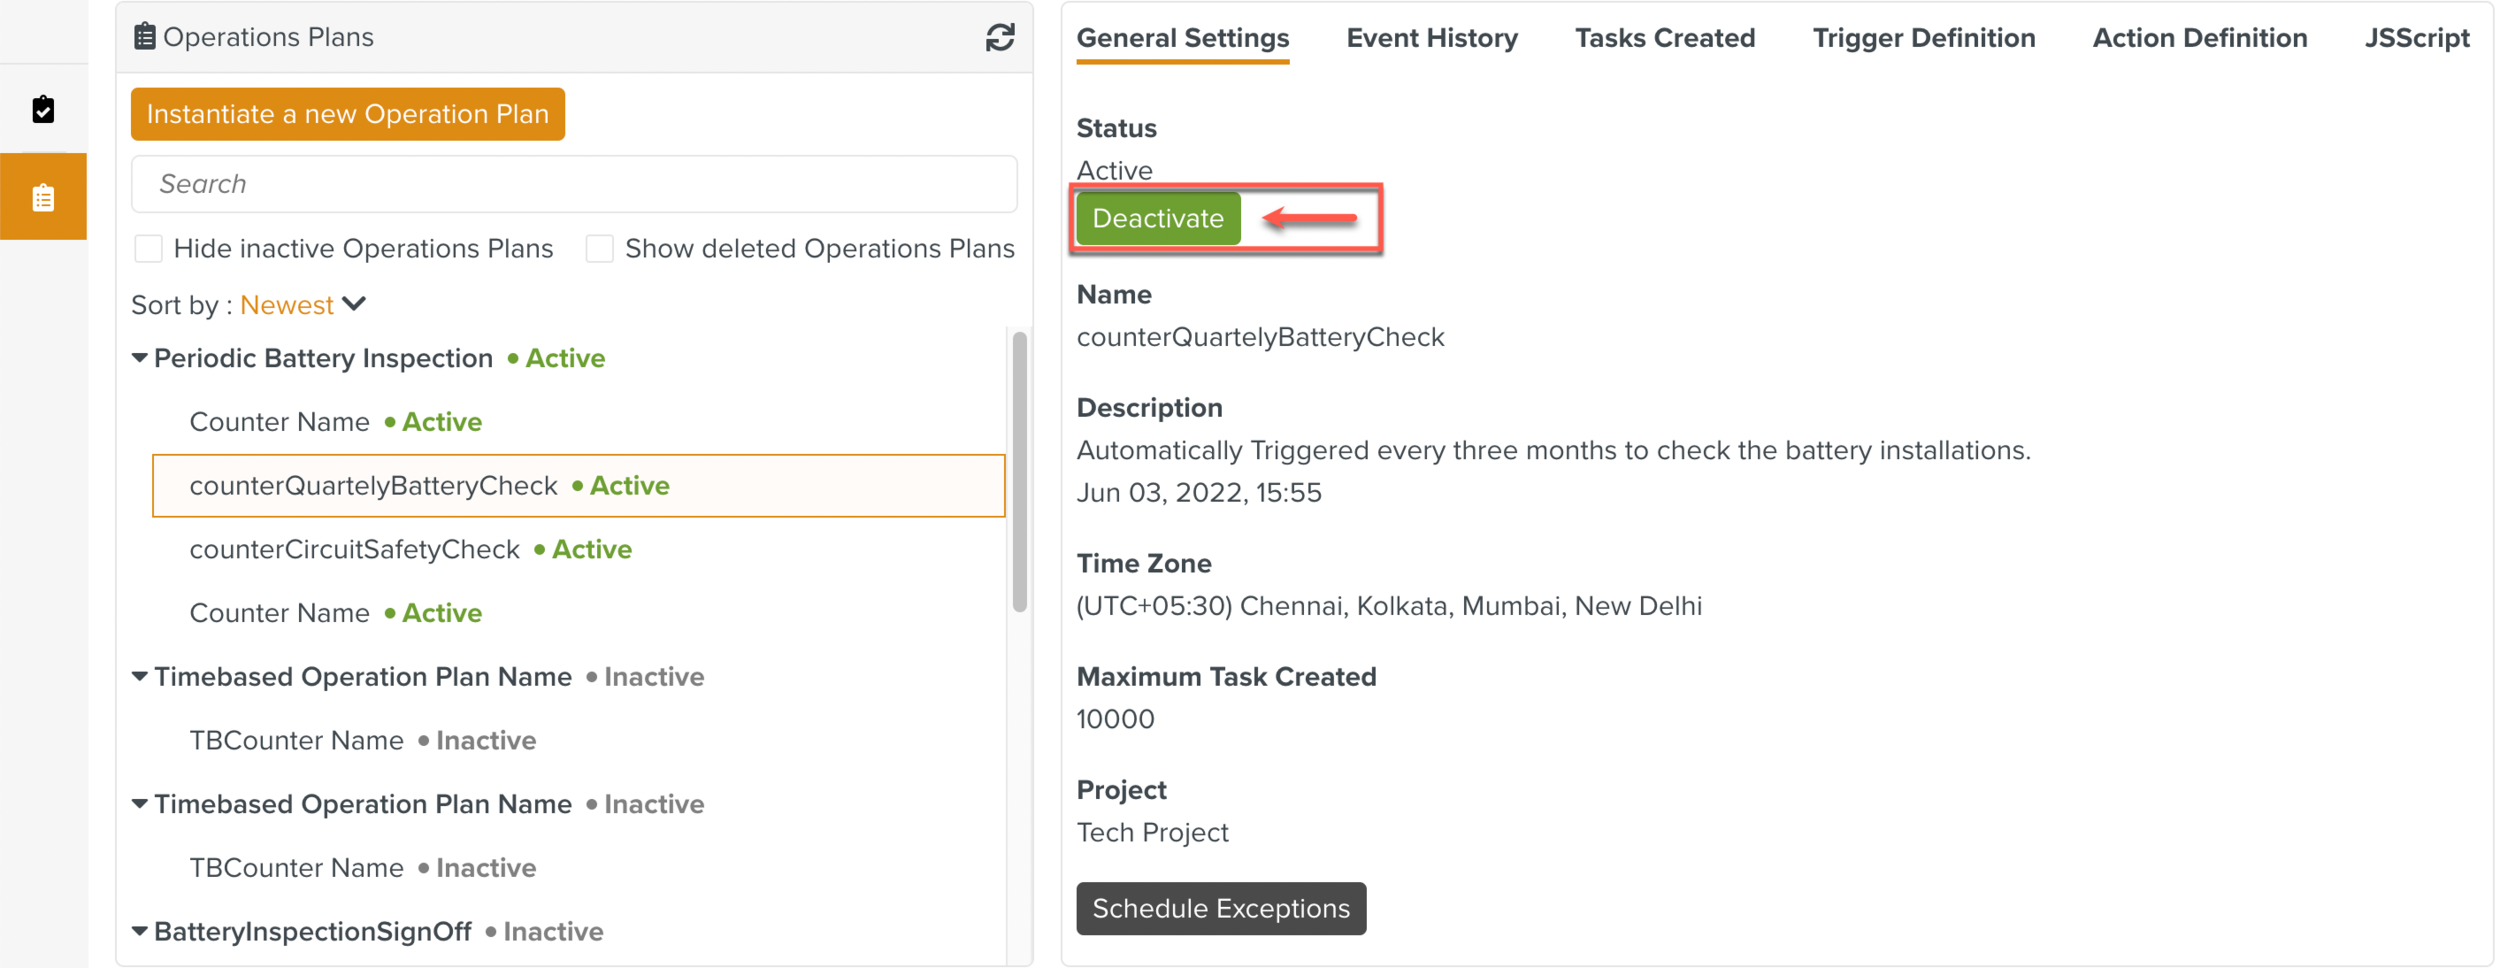
The Counter is deactivated as shown below.
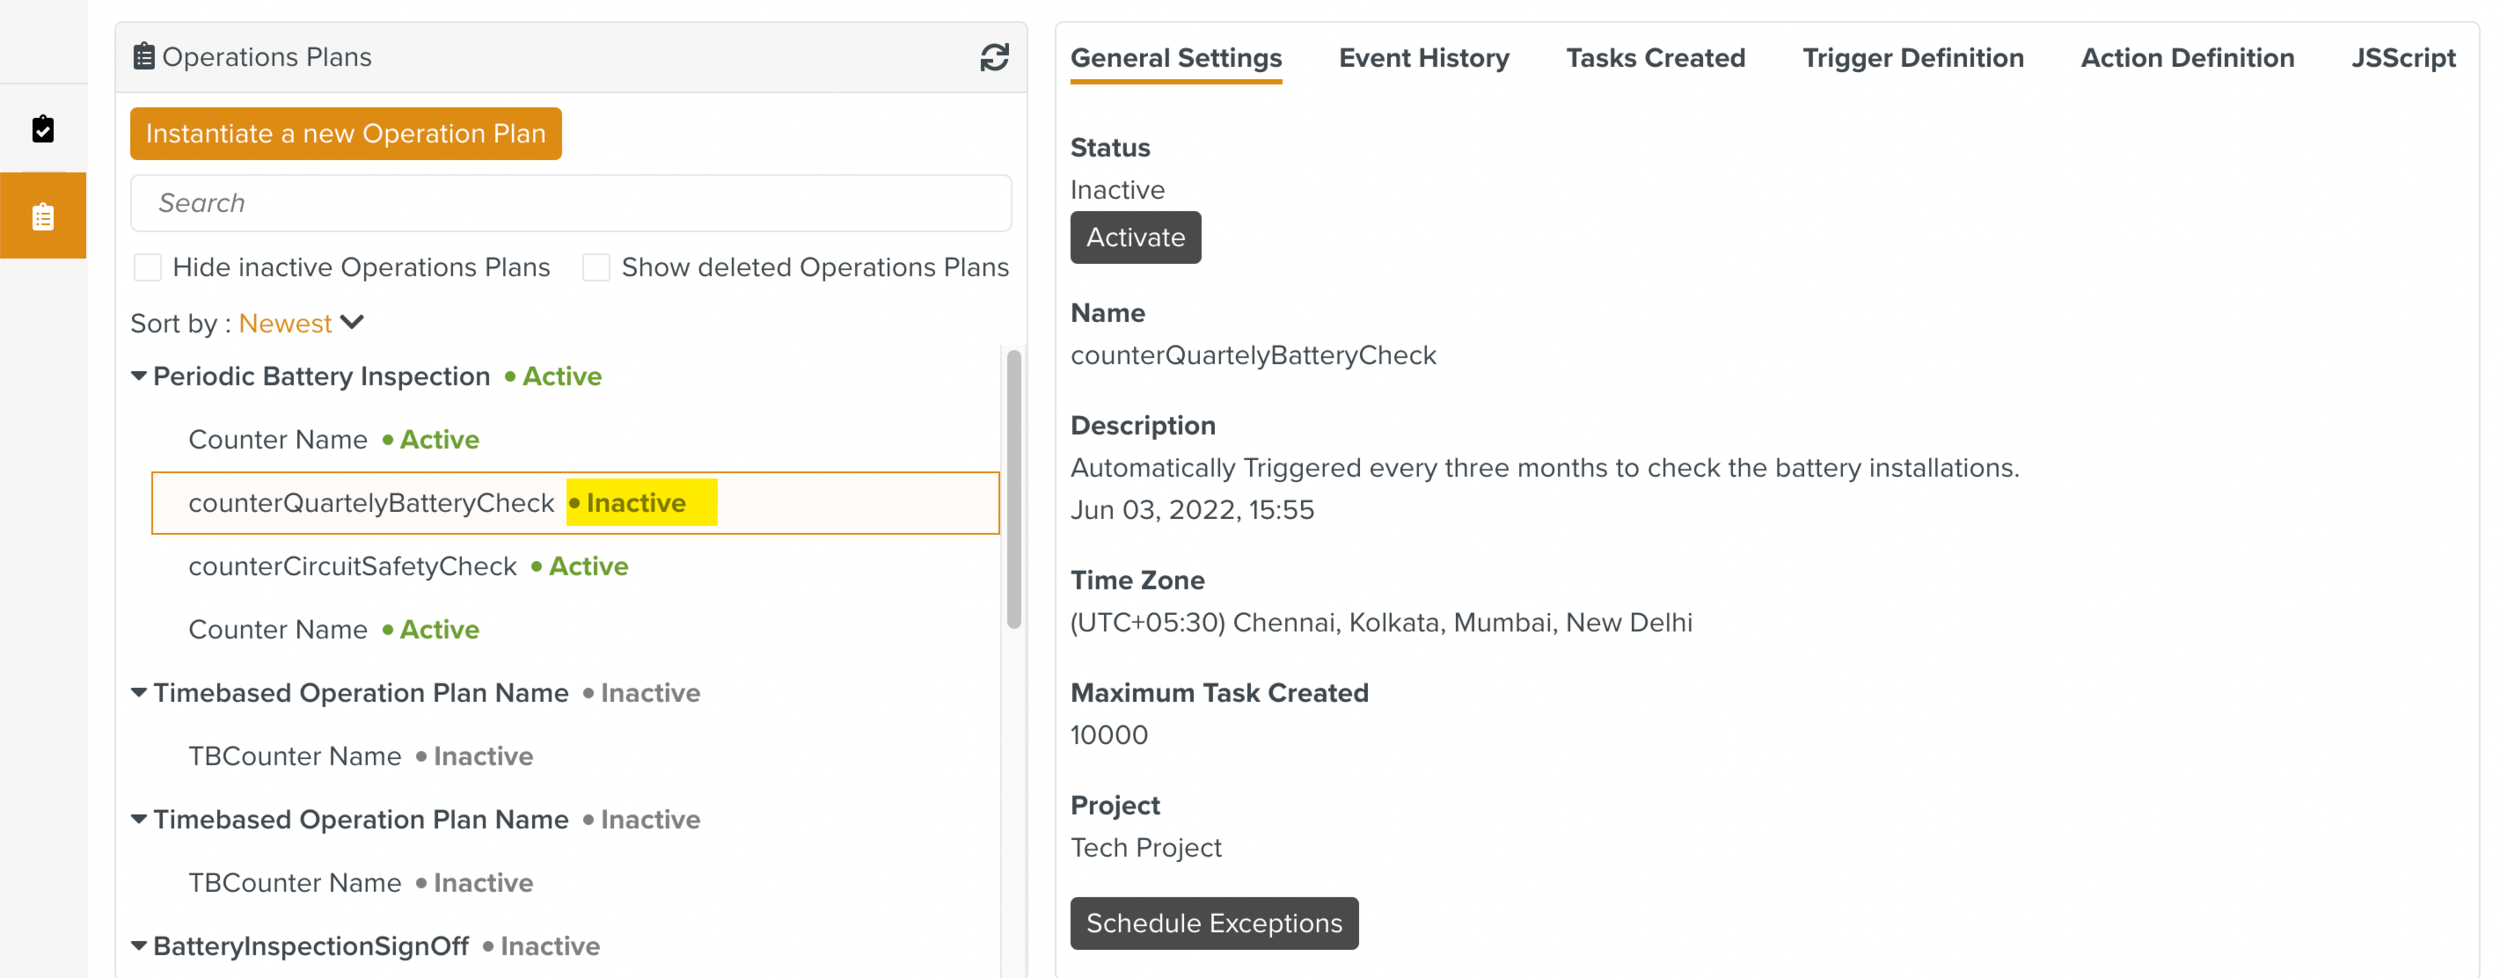
Once an Operation Plan Execution is activated, it logs the and the as and when they occur. This information remains even if the Operation Plan Execution is deactivated later.
Click the instance of the Operation Plan Execution as shown below.
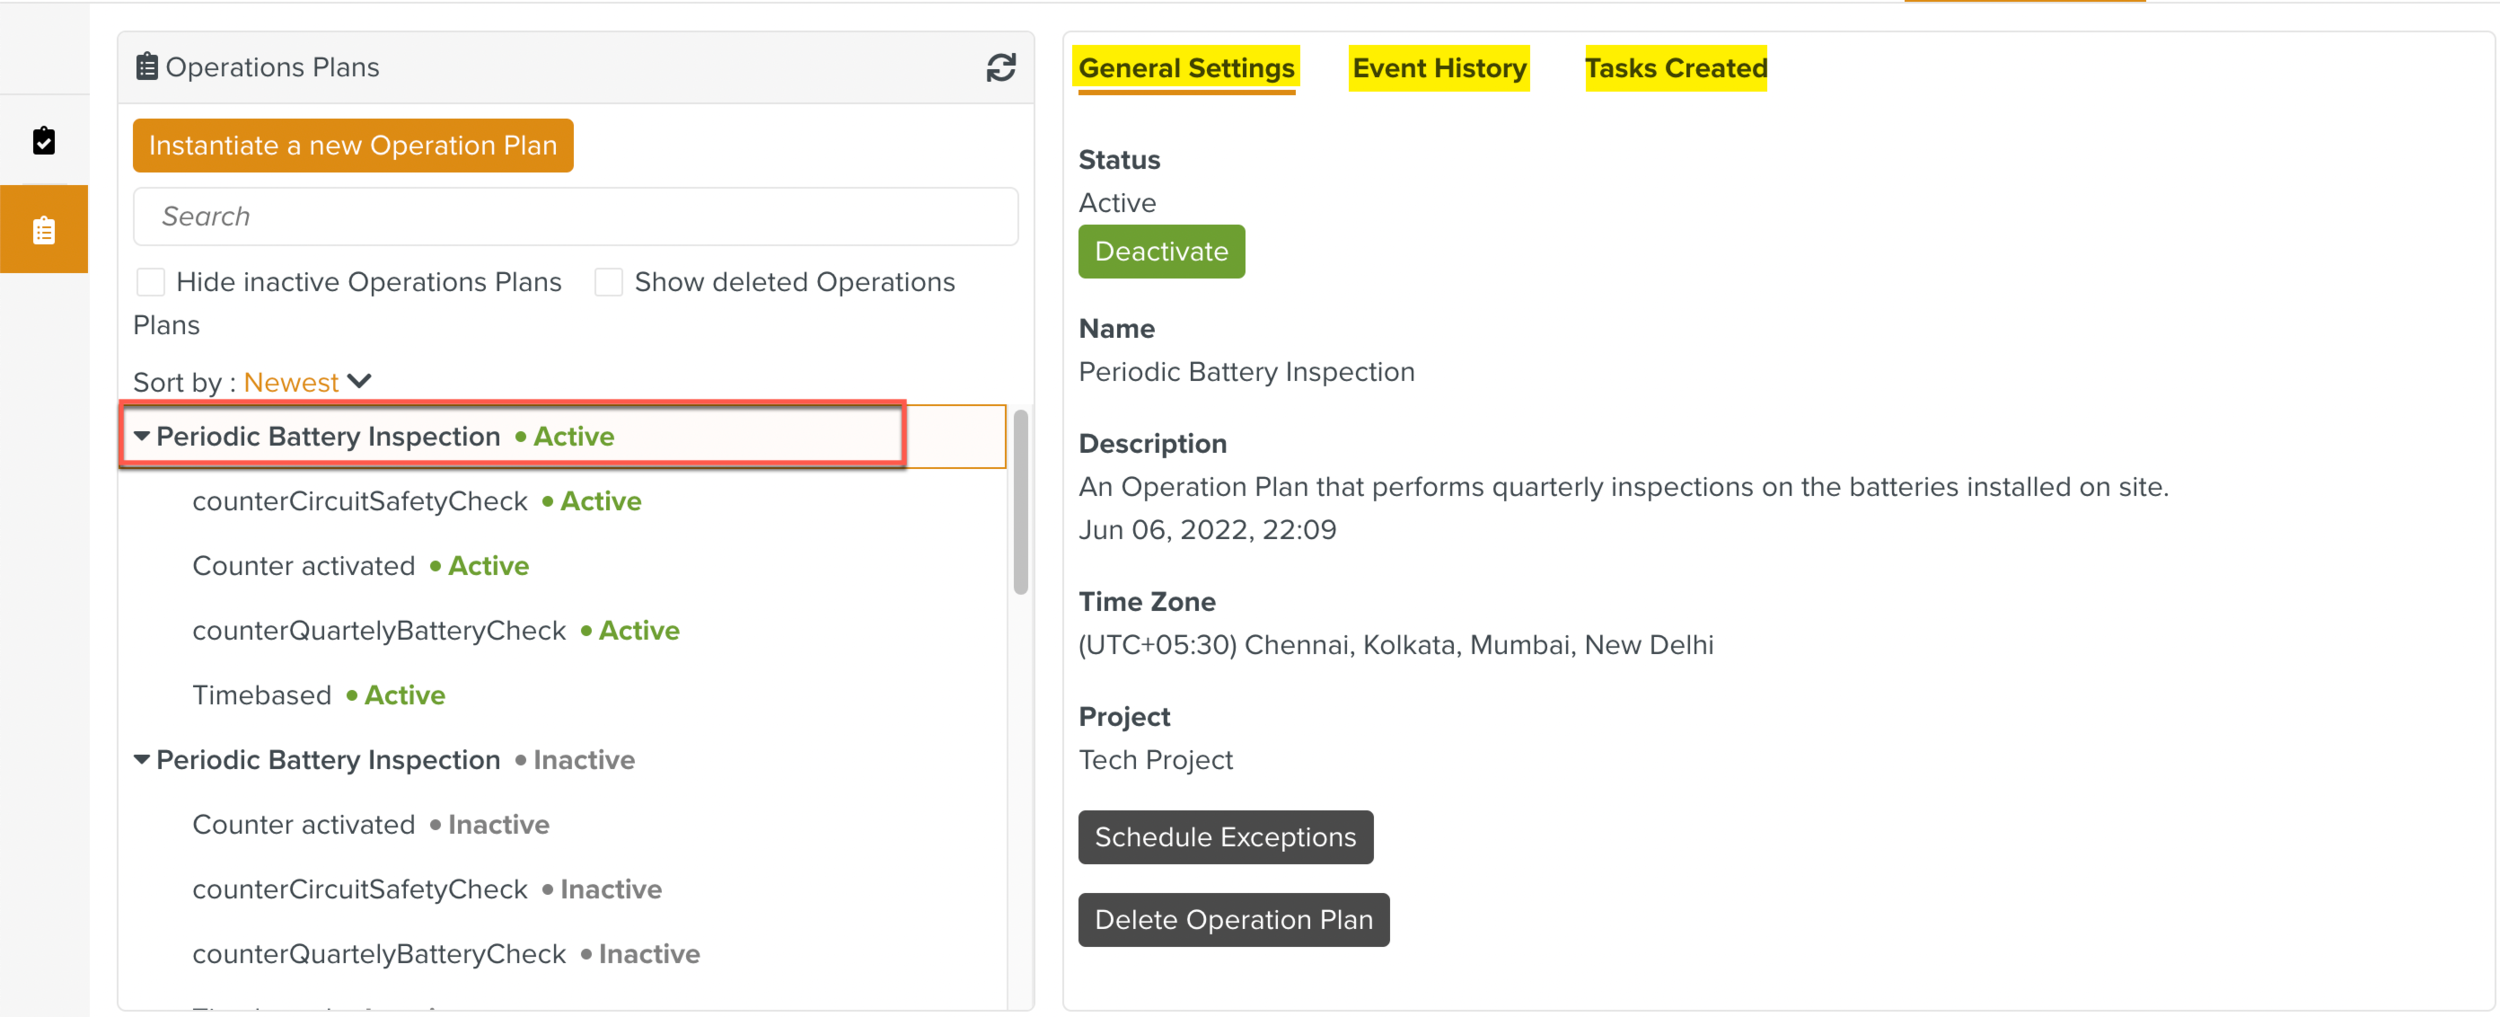
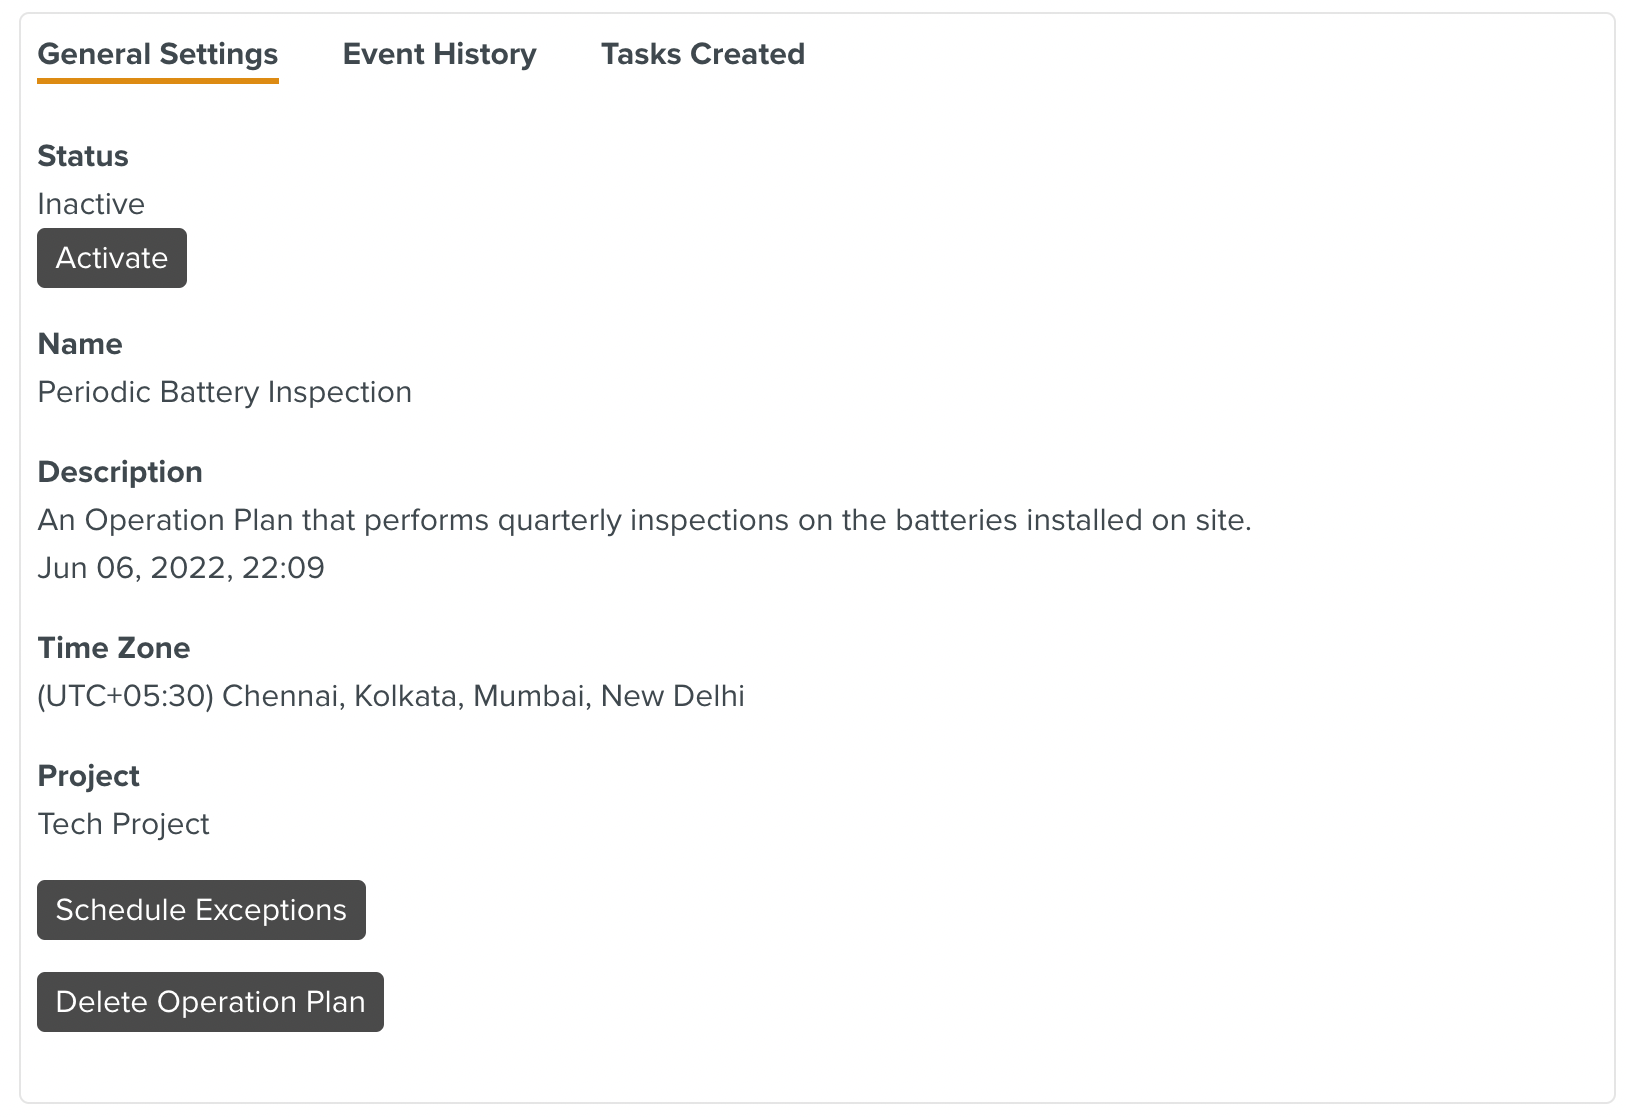
There are three tabs - General Settings, Event History and Tasks Period.
This tab provides general information about the Operation Plan Execution - Name, Description, Time Zone and the Project.
 |
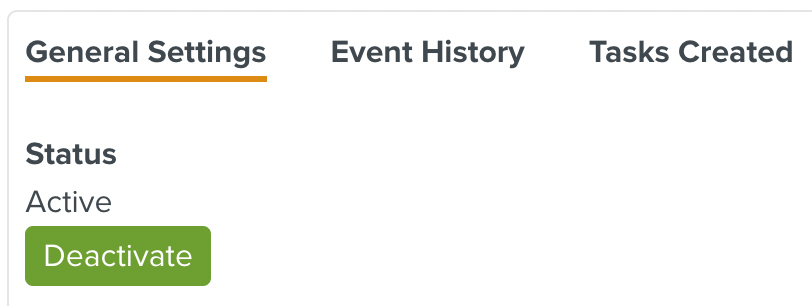
This tab also provides the current status of the Operation Plan Execution - Active/Inactive. You can activate or deactivate the Operation Plan Execution using the or button in this tab.
 |
 |
Schedule Exceptions
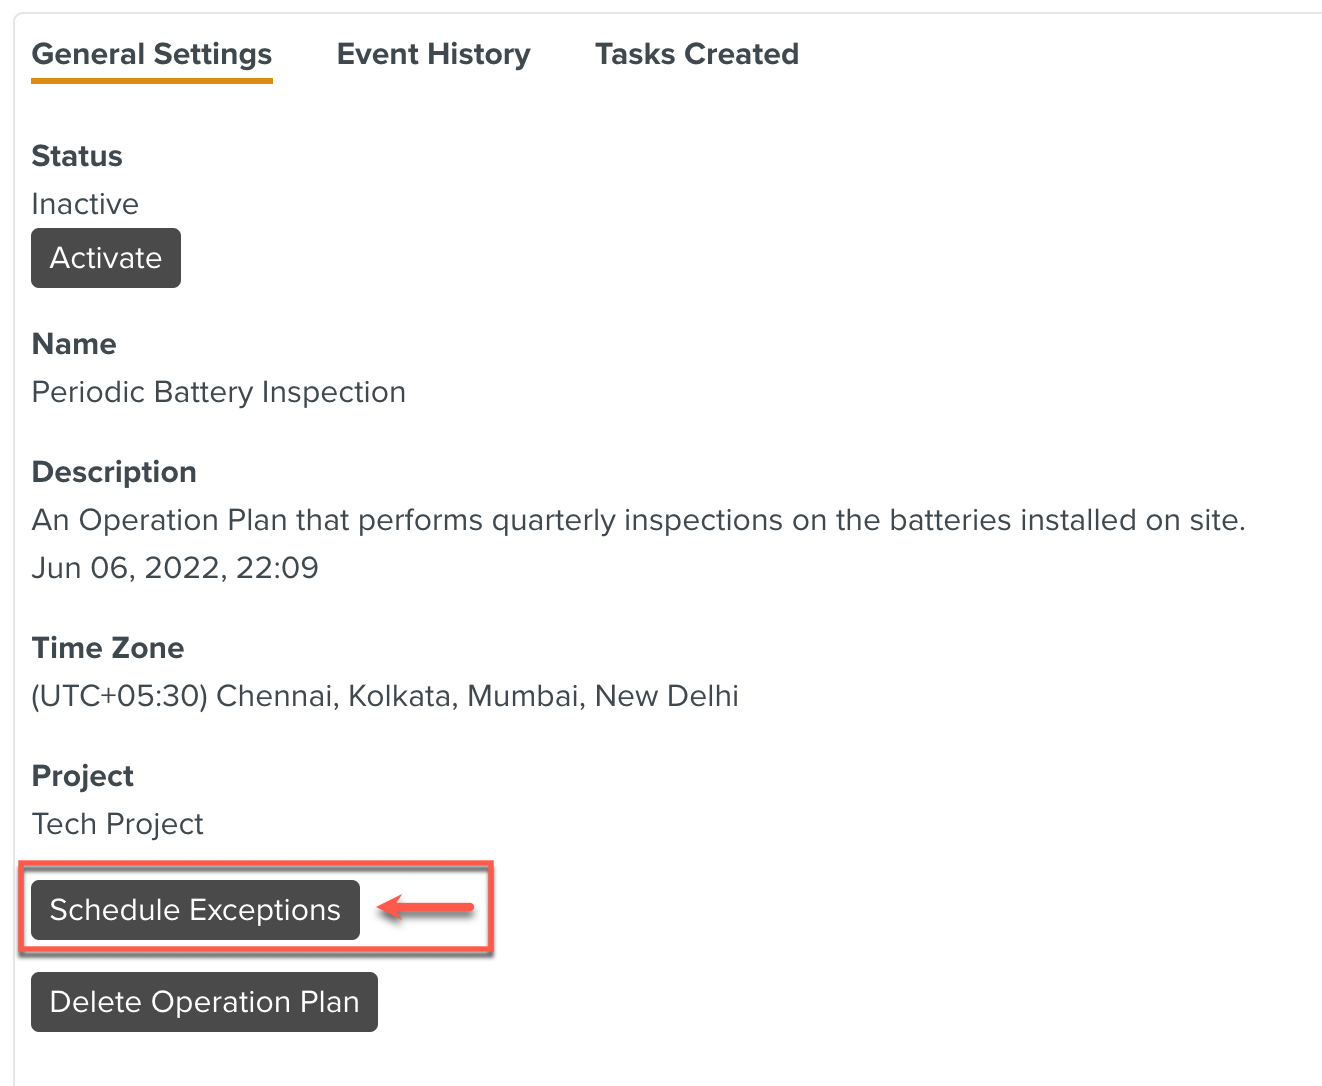
You can schedule exceptions to any time-based Event Triggers included in this Operation Plan Execution.
To schedule an exception:
Click .
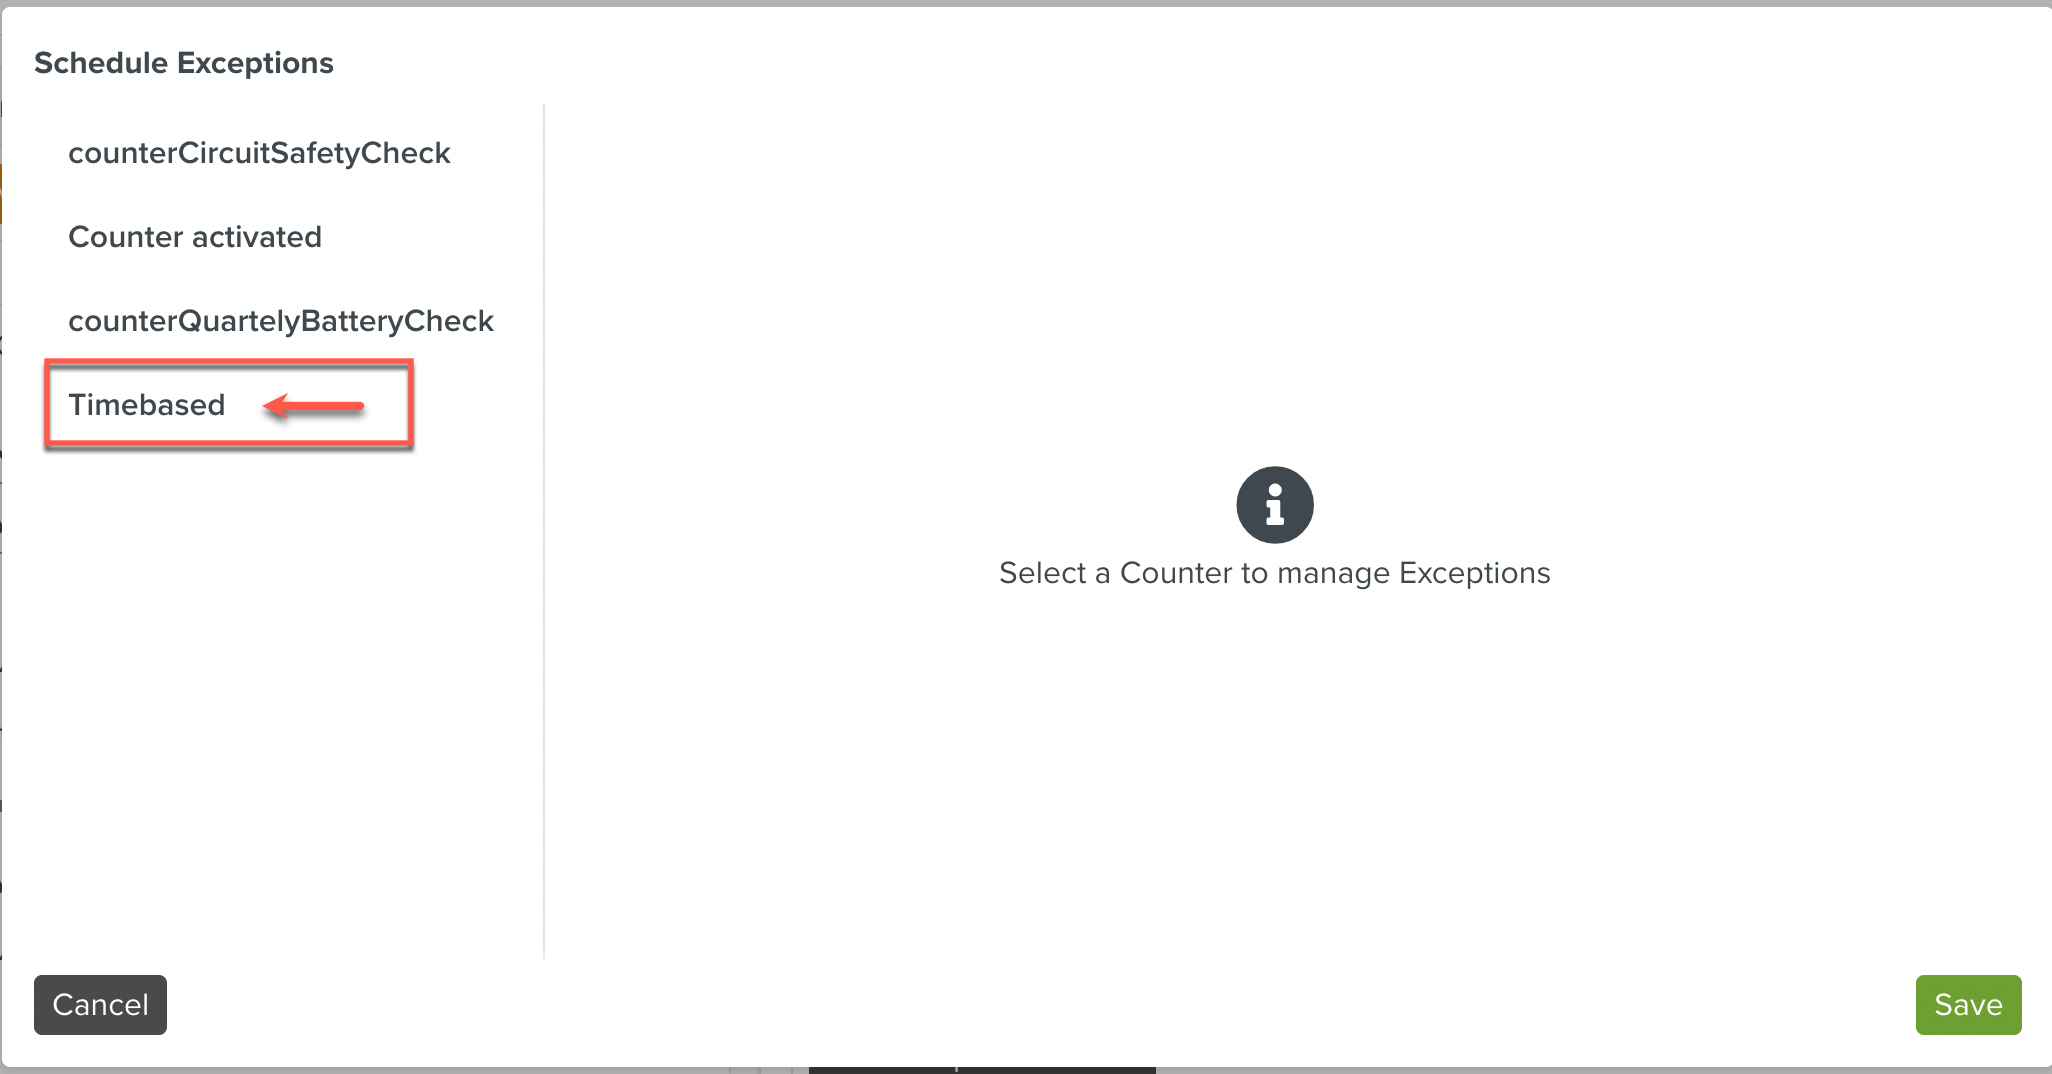
Select a Counter with a time-based trigger.
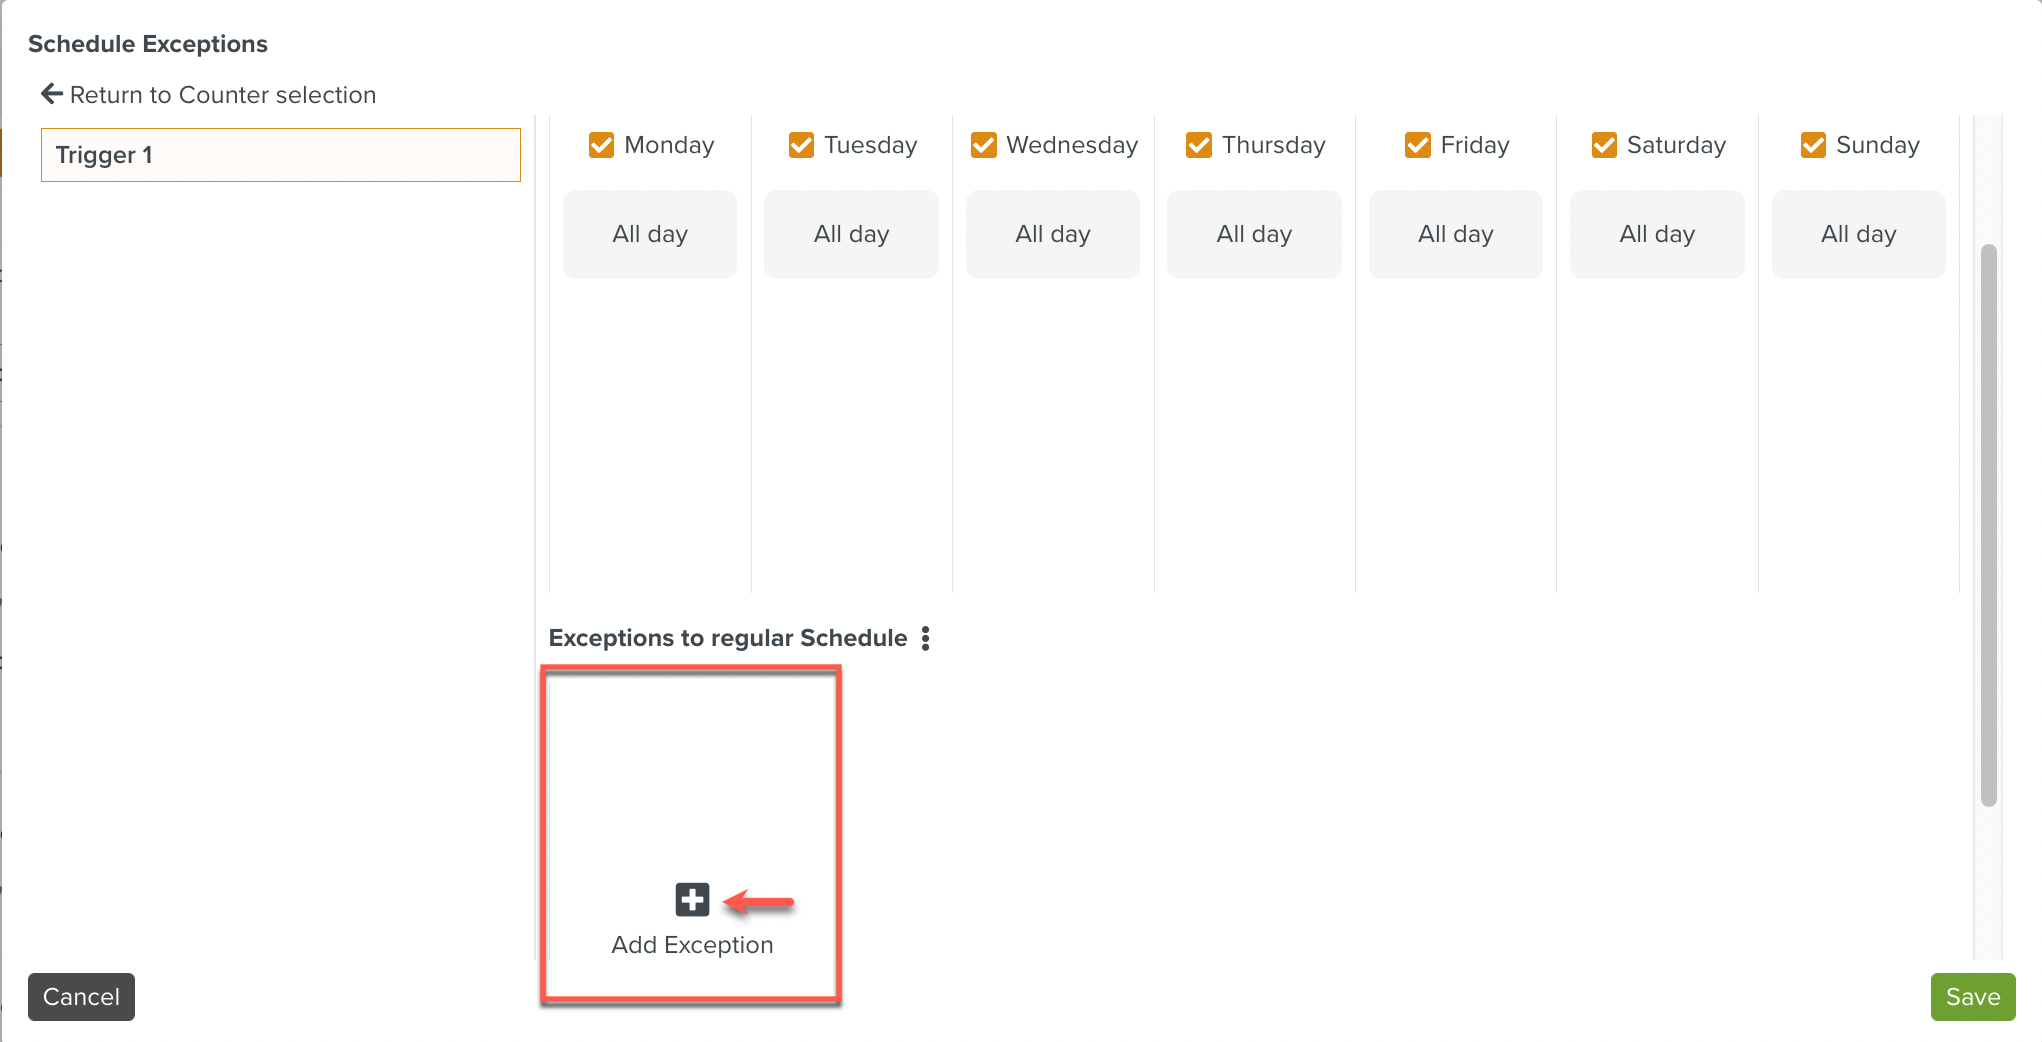
Click .
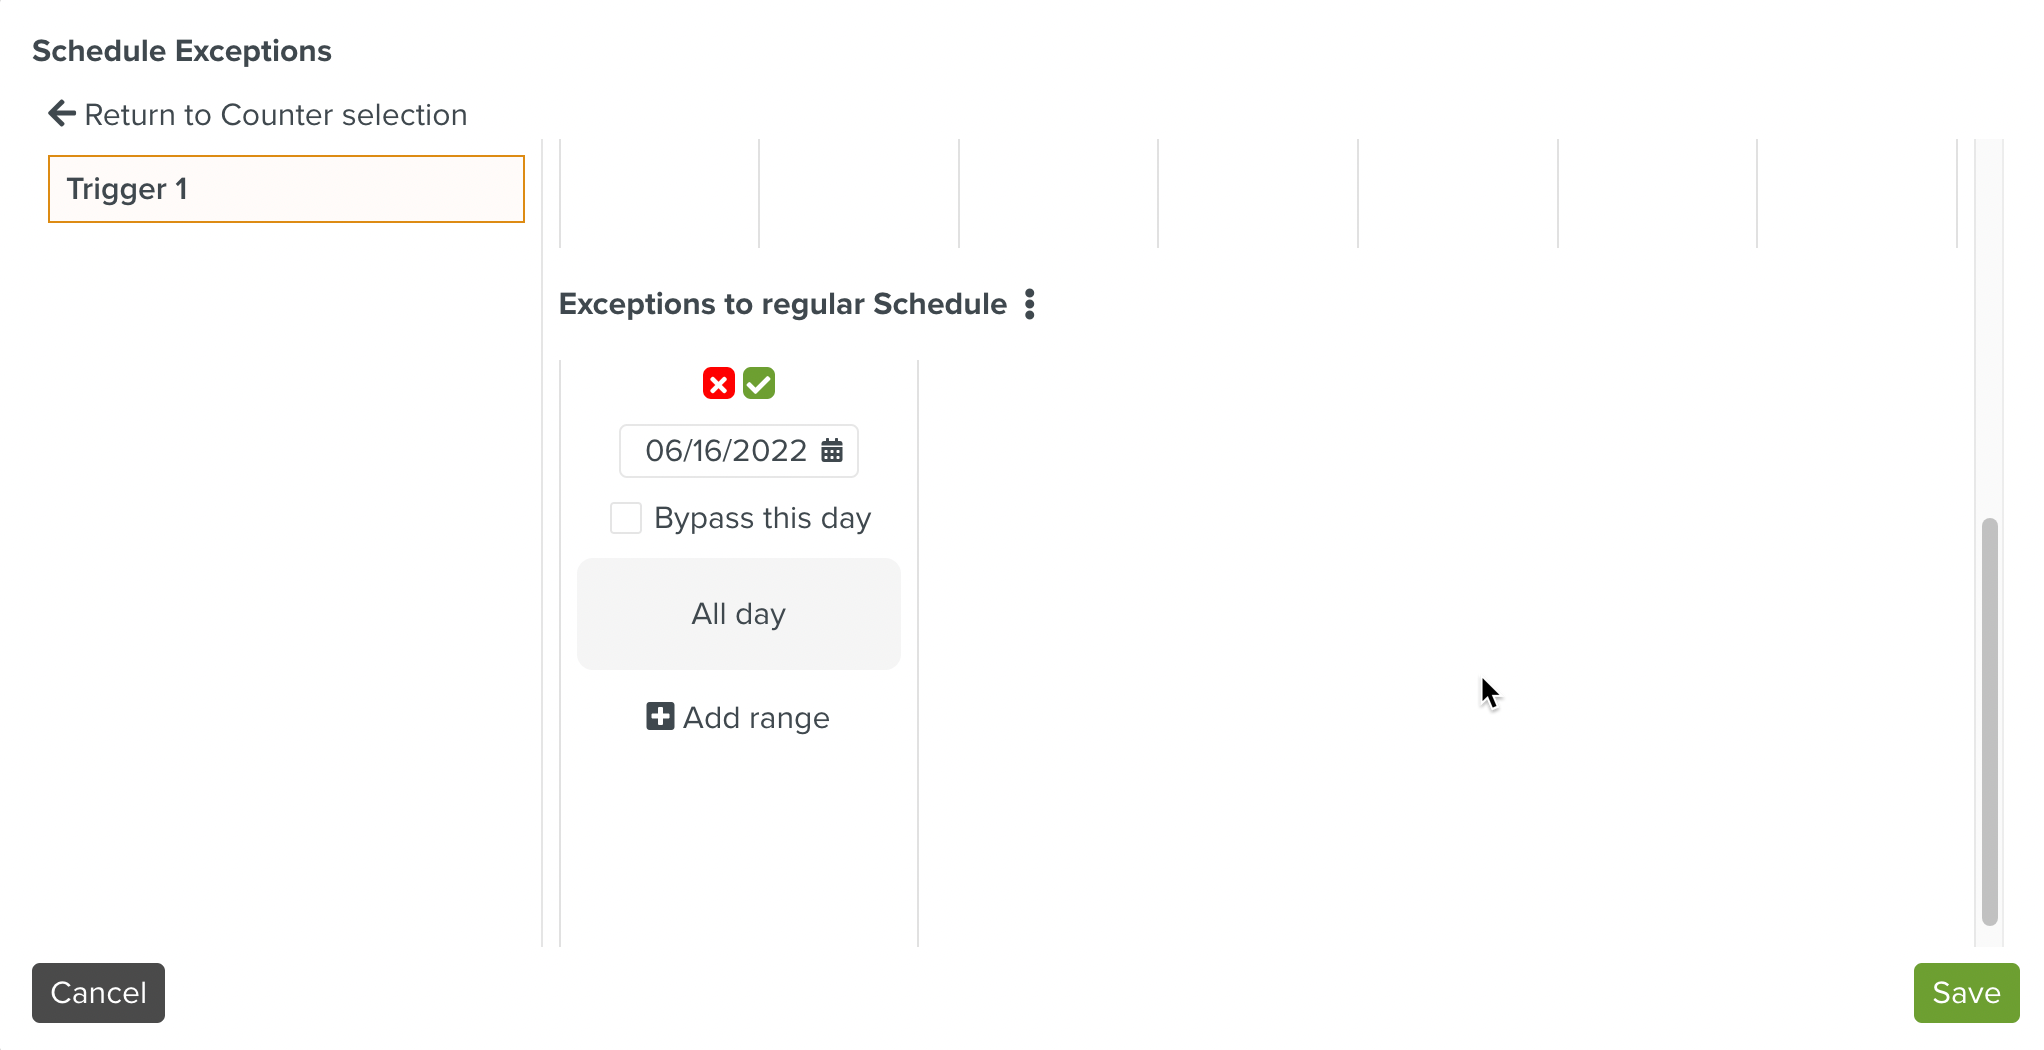
Configure the Exception.
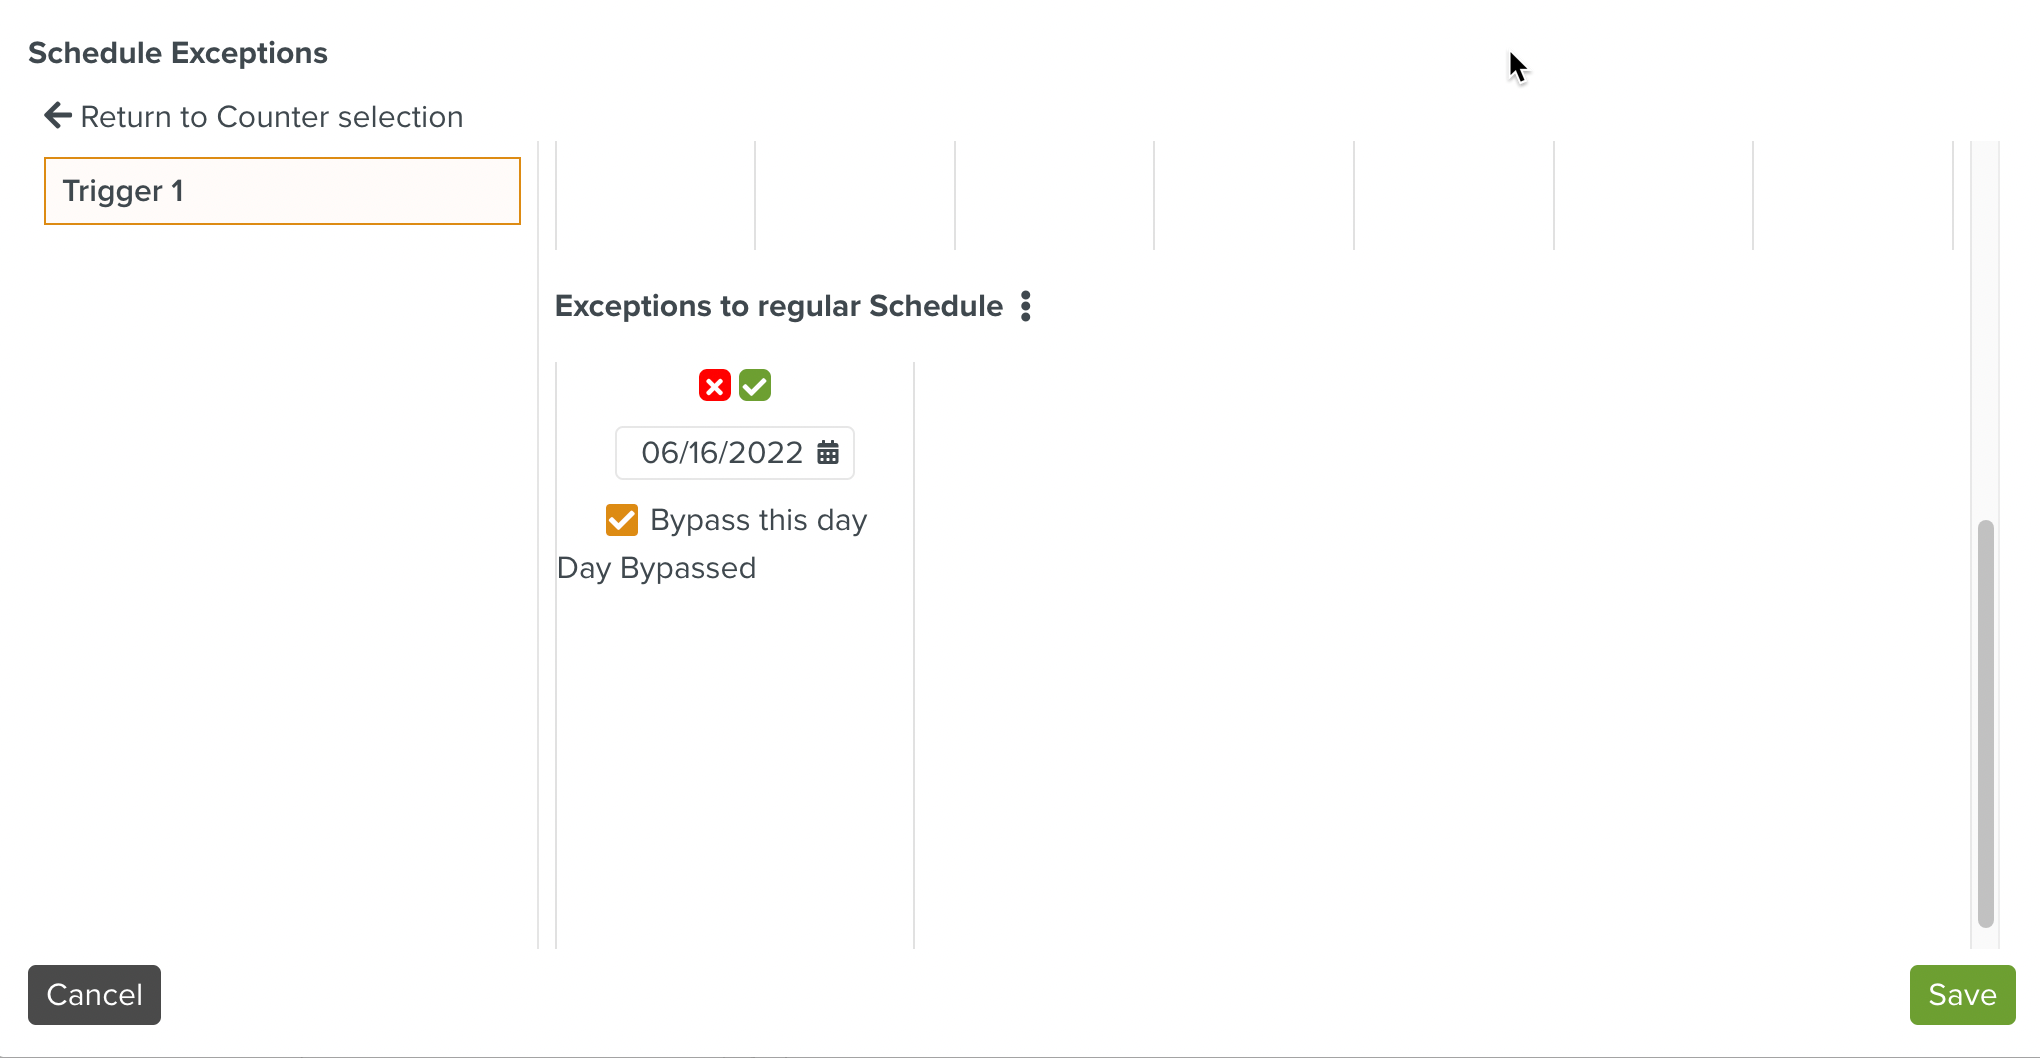
You can choose to not run the Trigger the whole day.
Or, you can choose to specify a time window when the Trigger should not run.
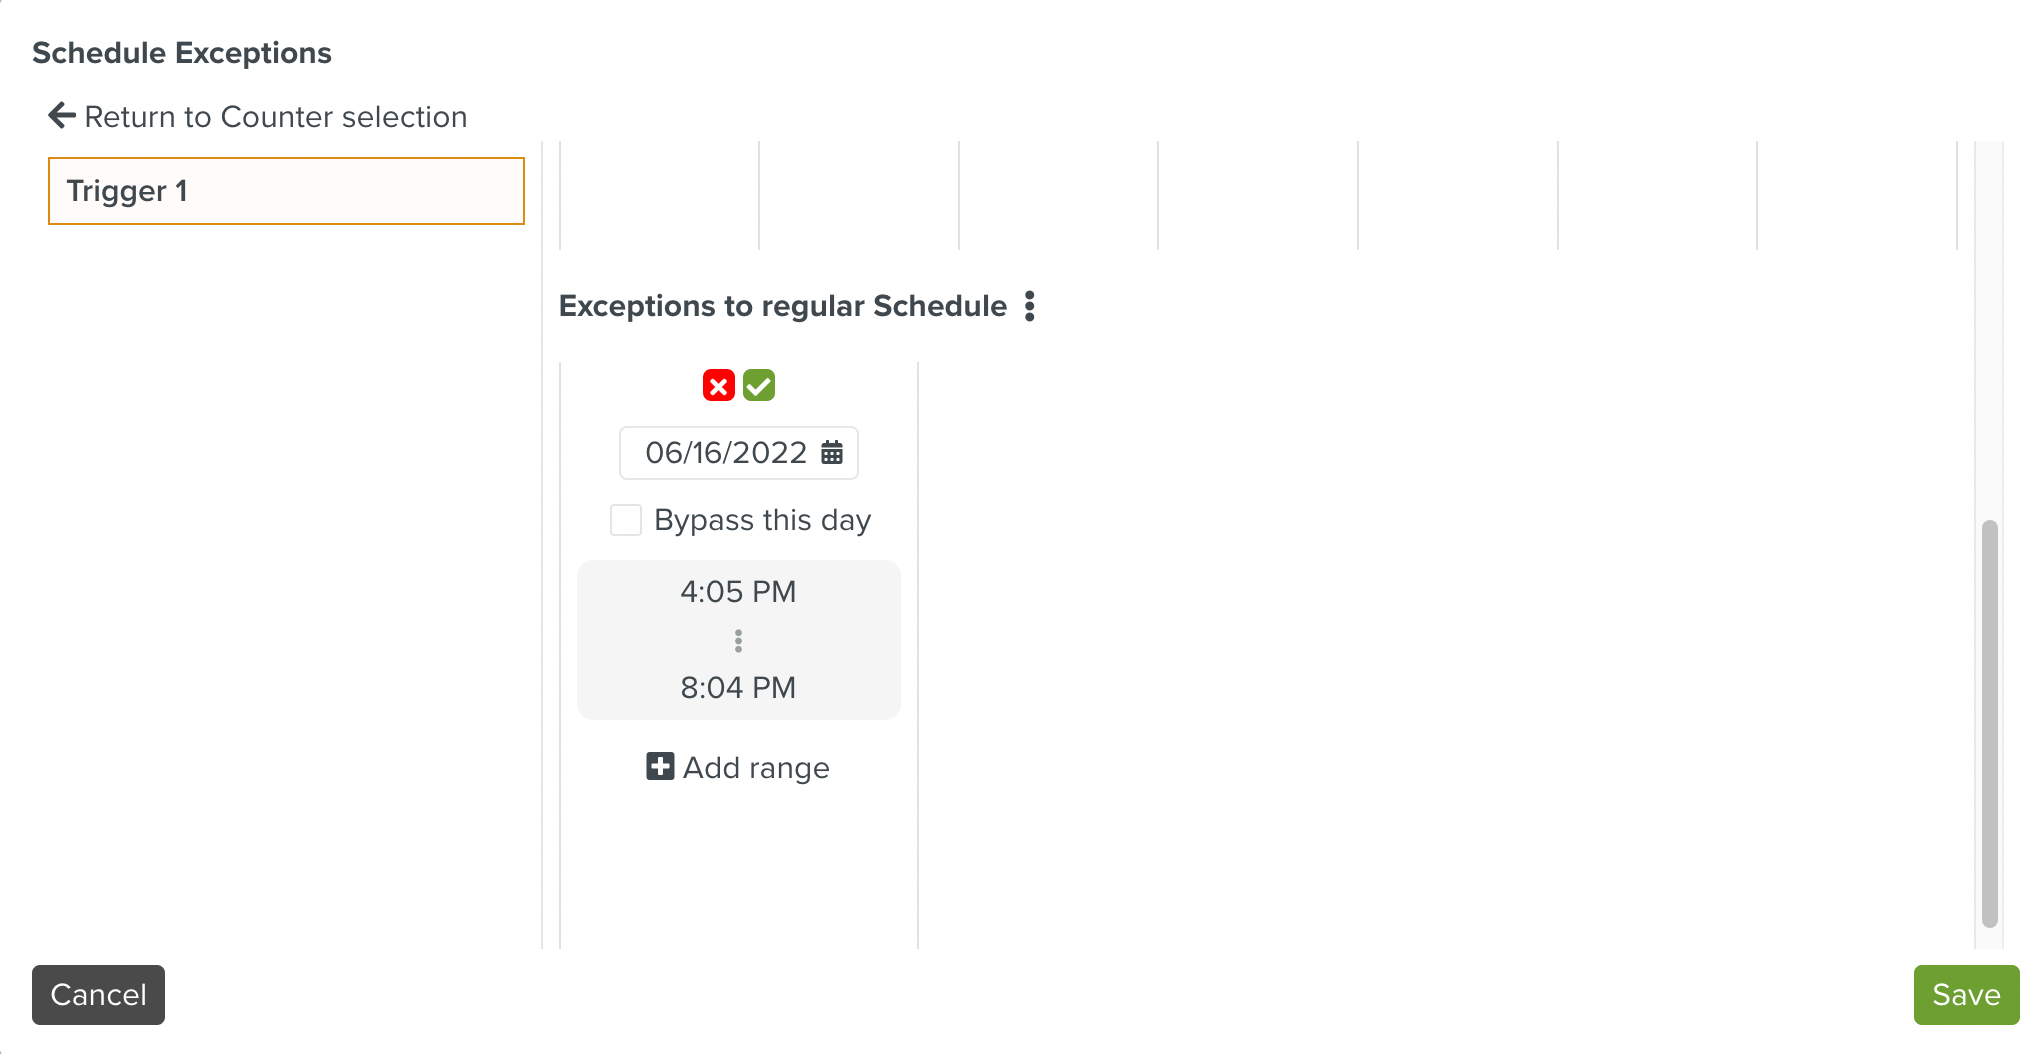
Click
 to validate the current exception. You can add another one, if required.
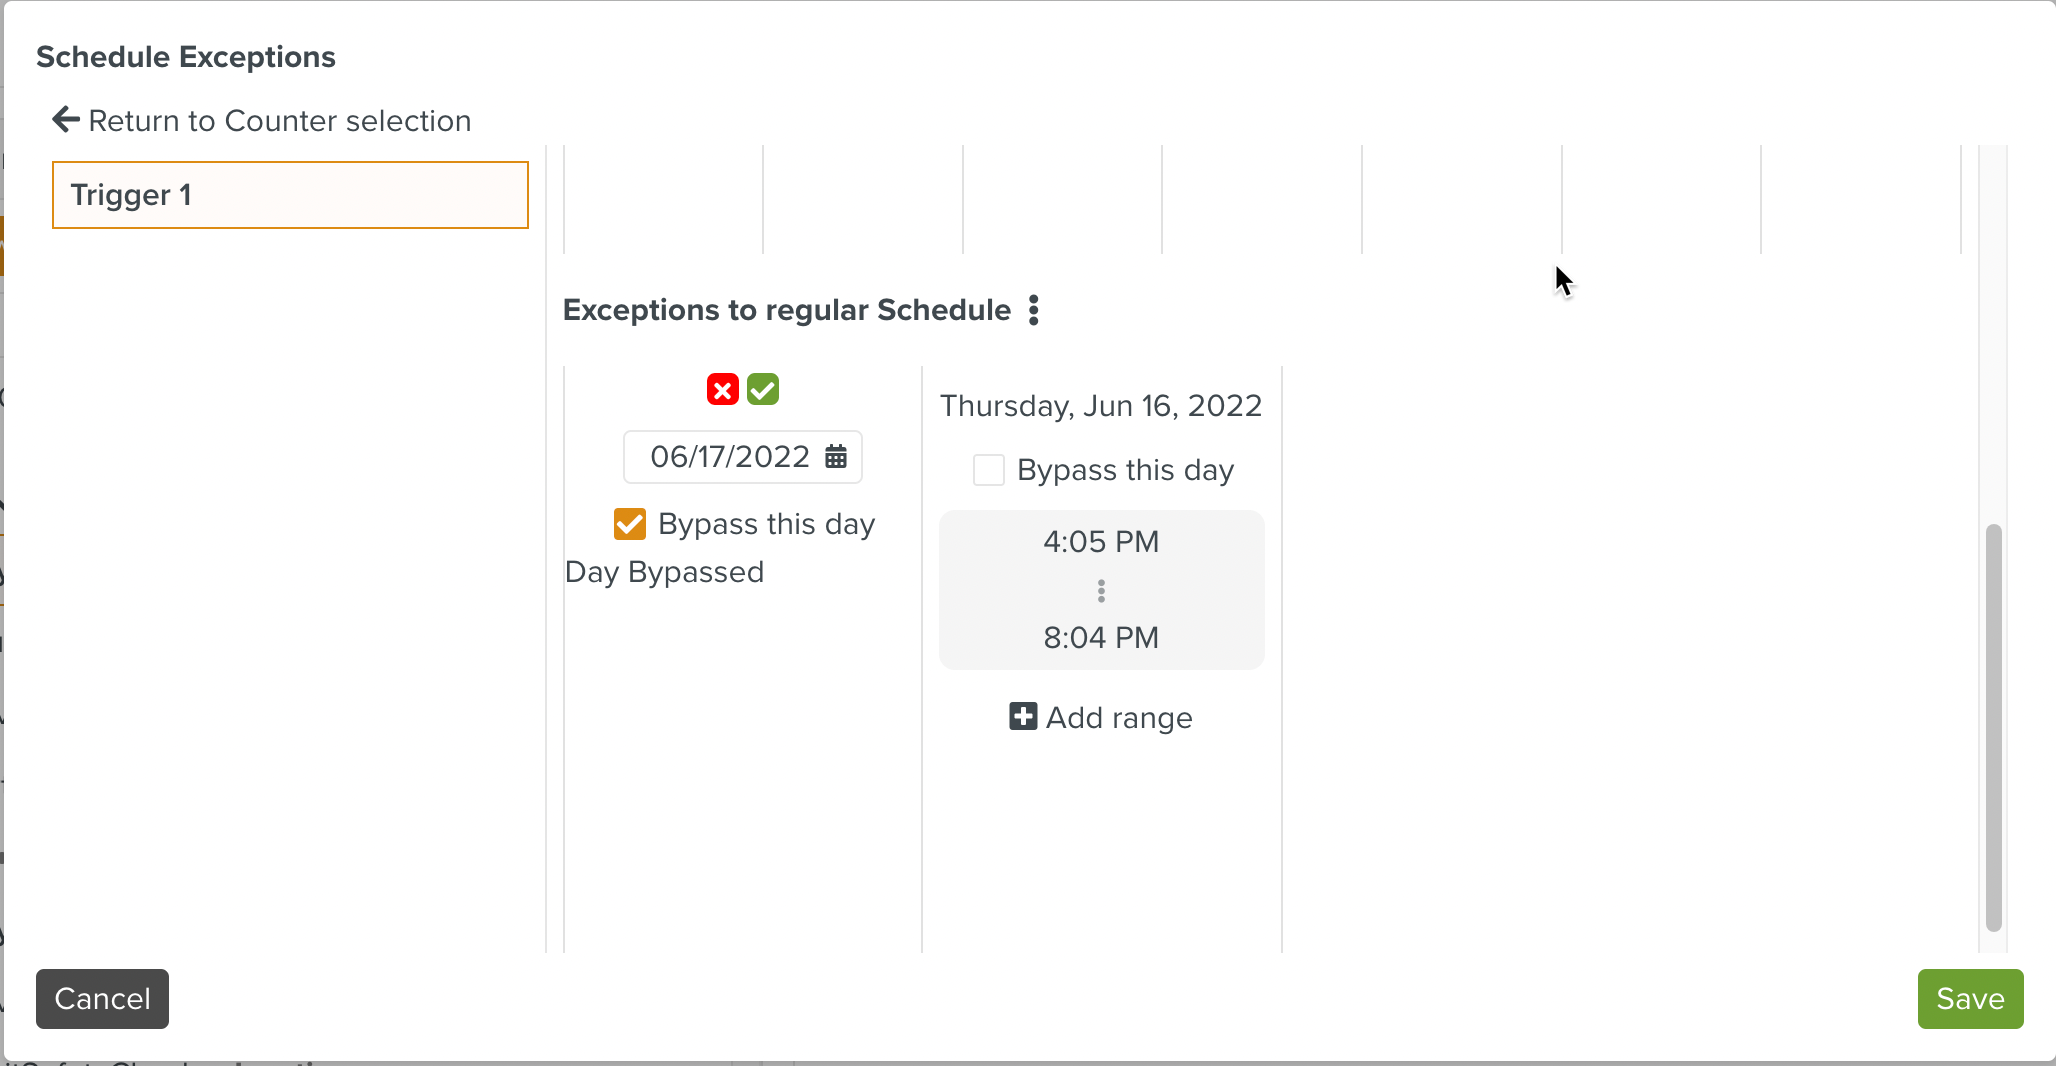
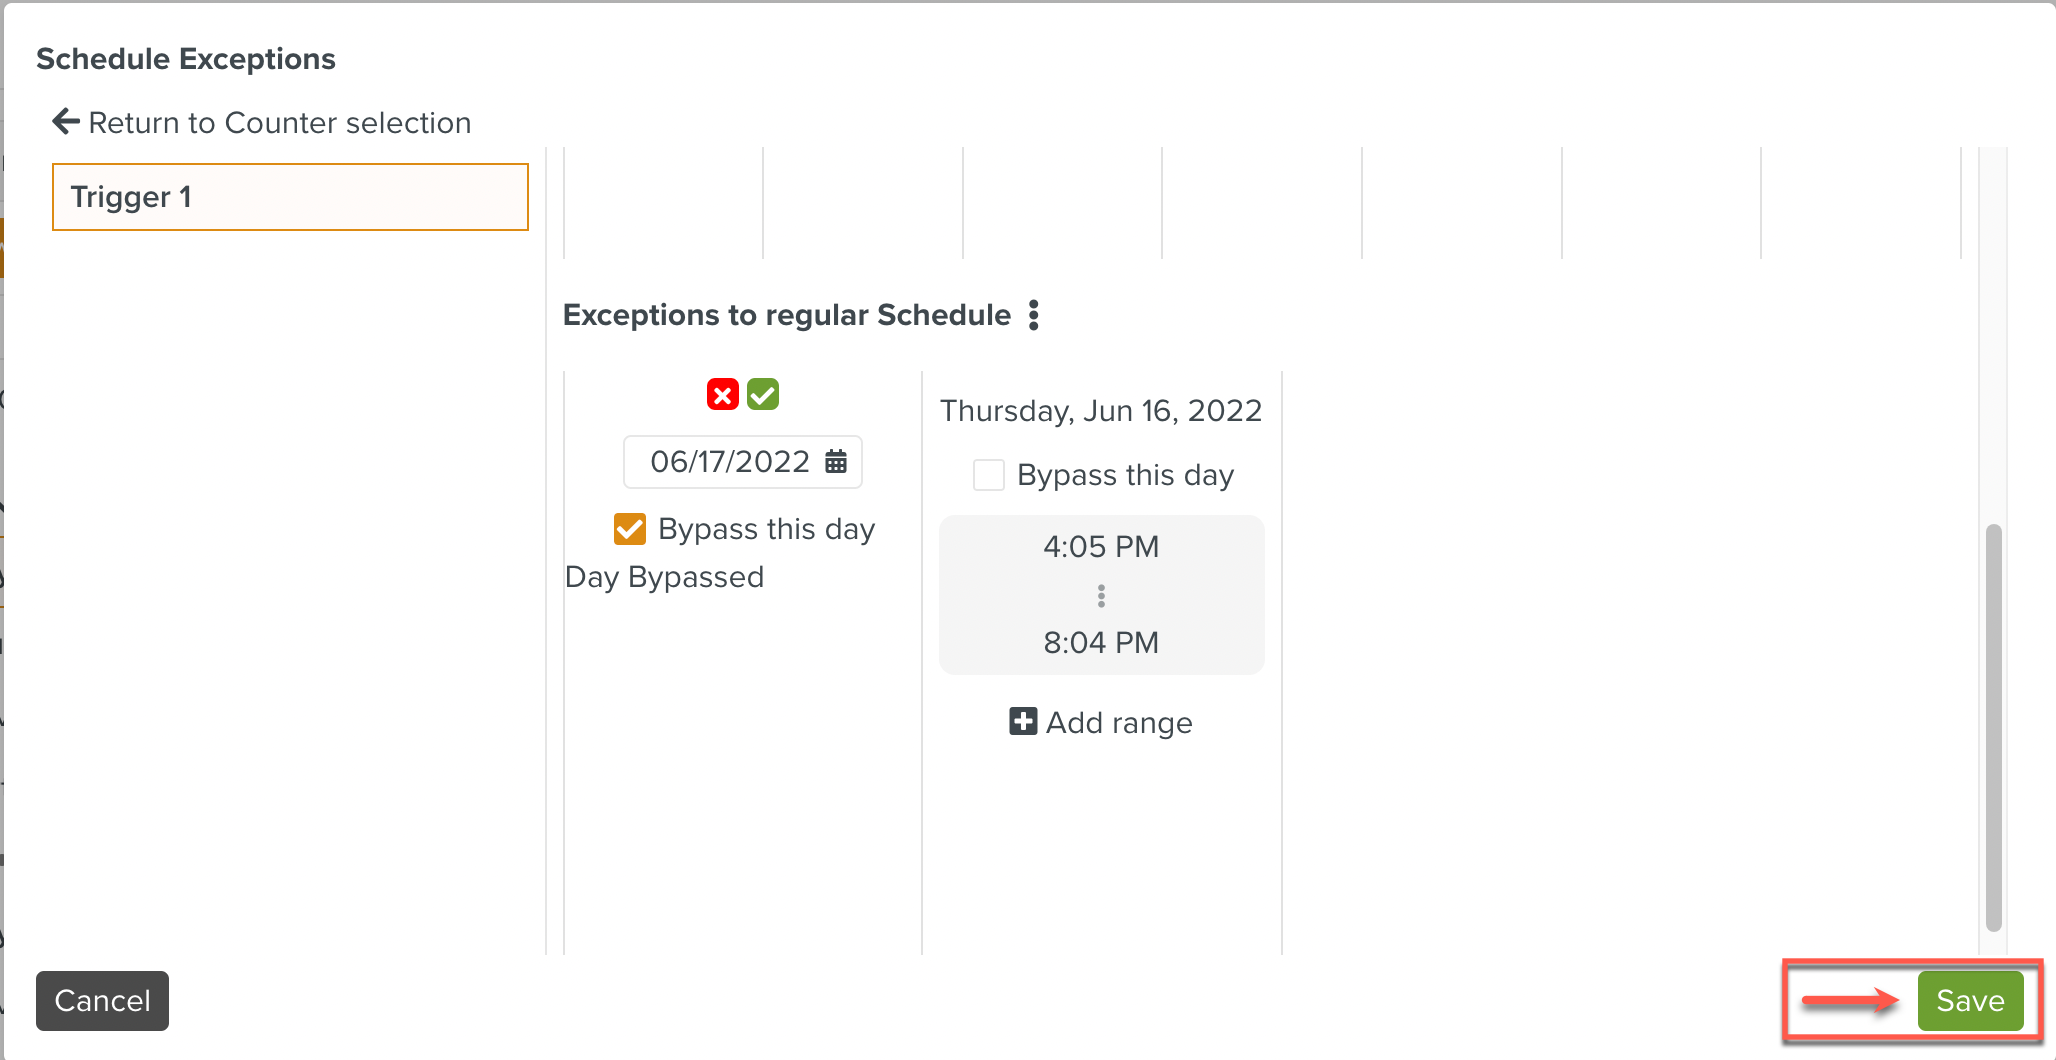
Click to save the exception(s) to the Counter.
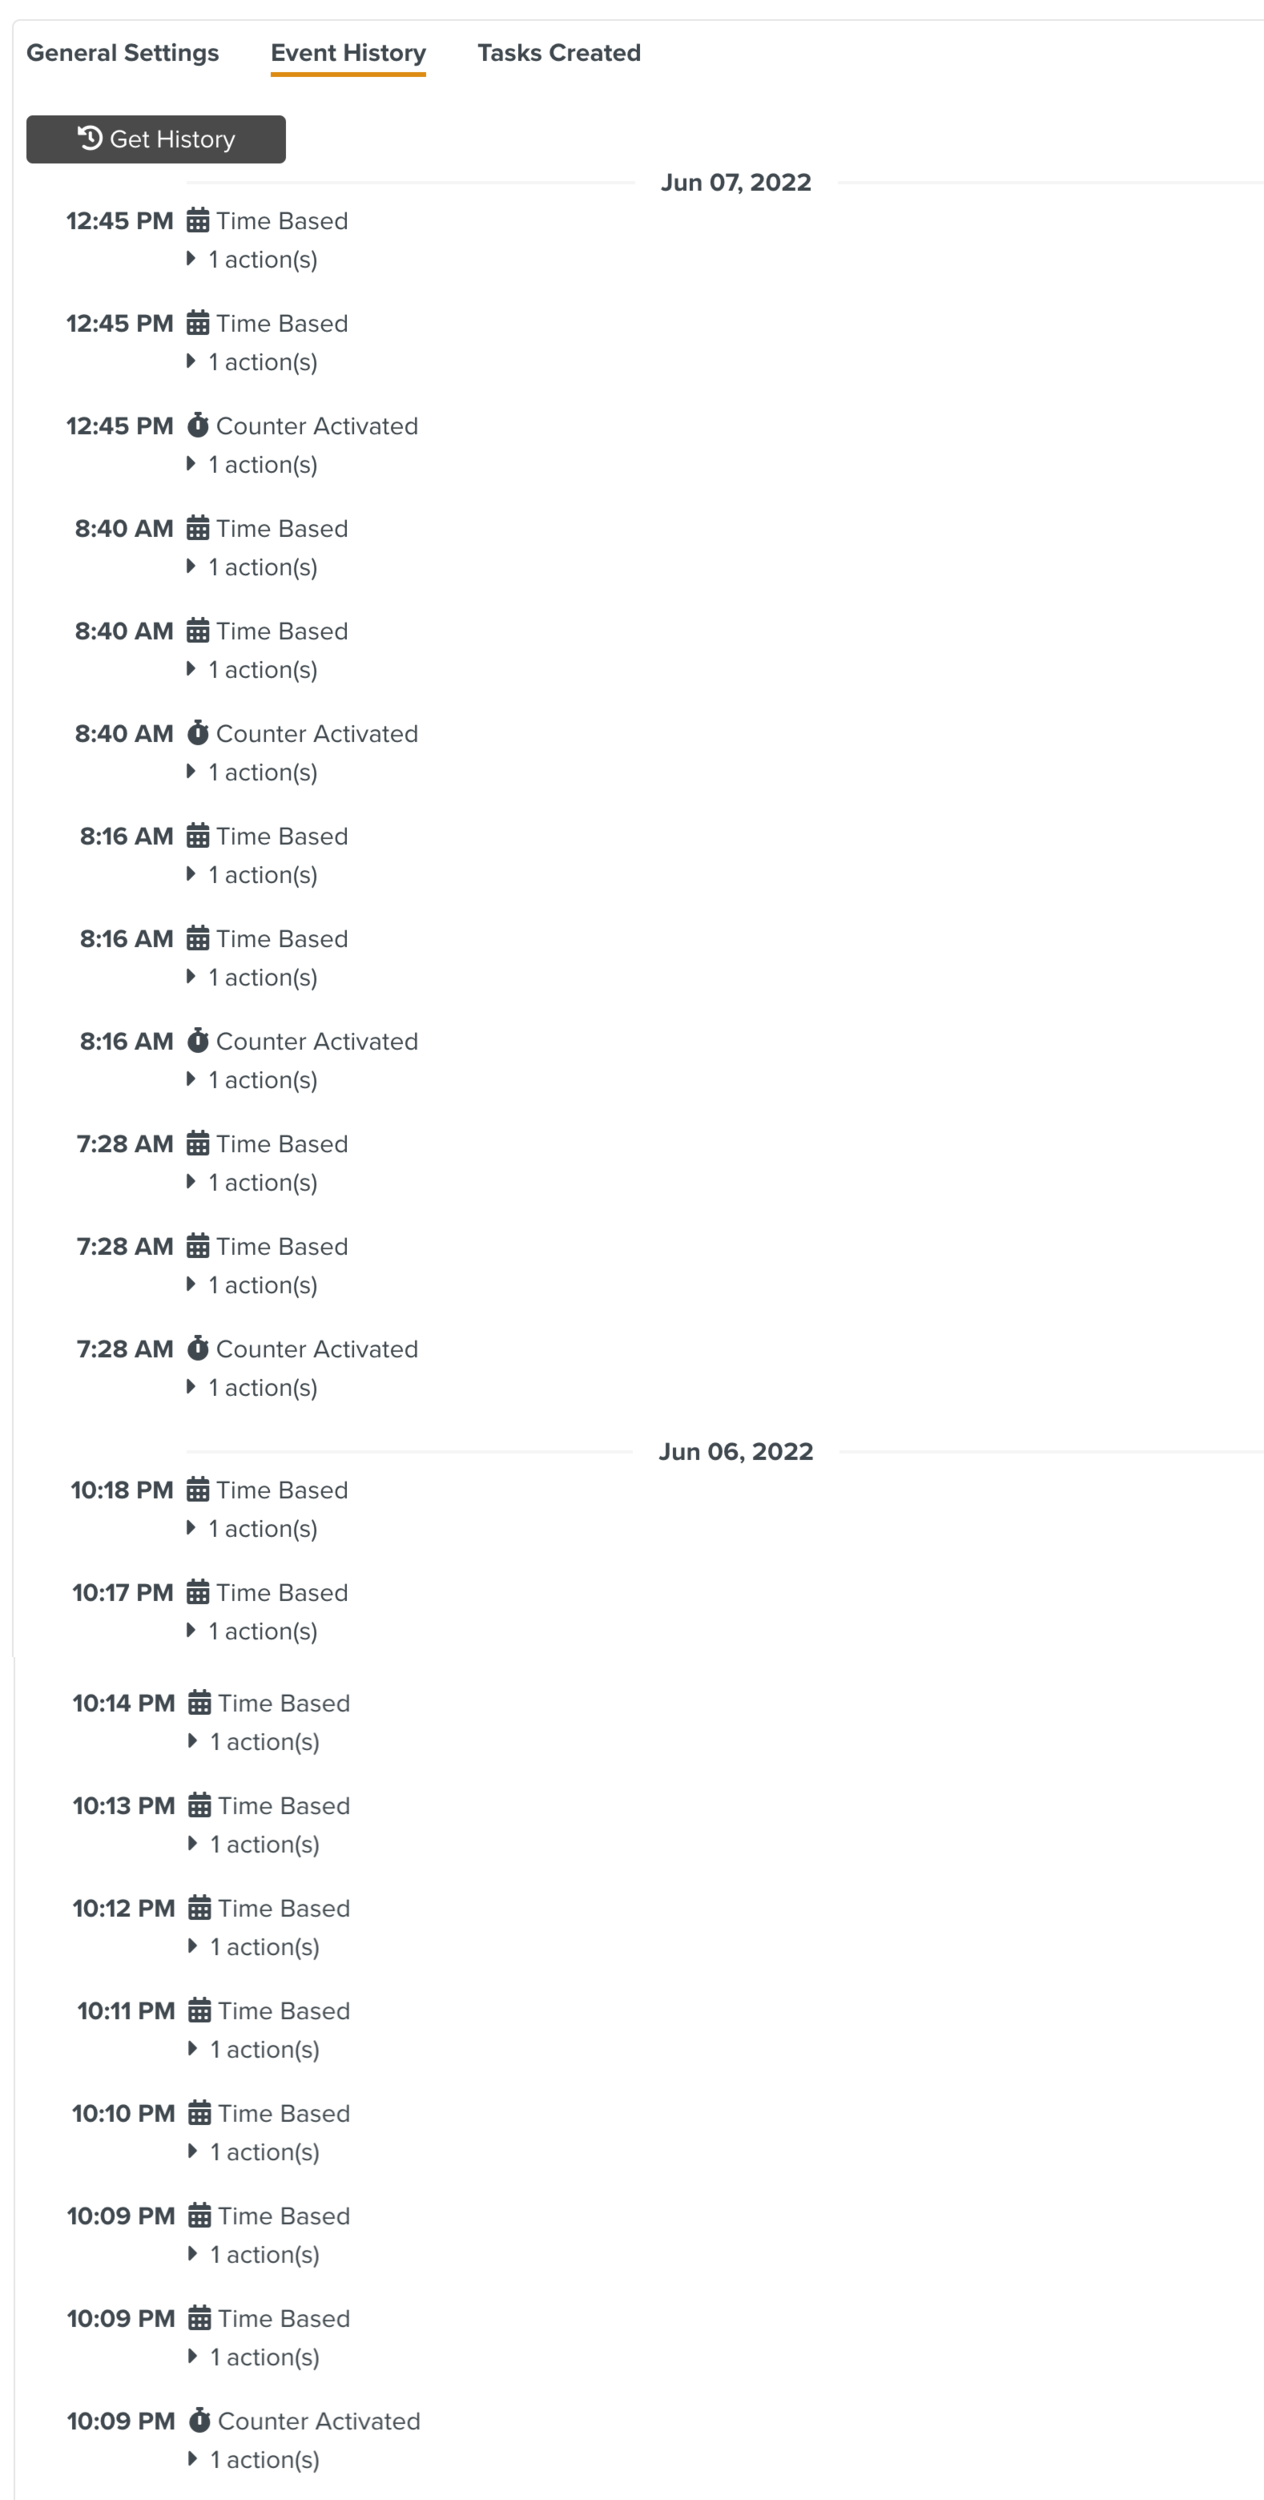
The Event History tab provides a log of all the Event Triggers that have occurred while the Operation Plan Execution was active.
To view the Event History:
In the tab, click .
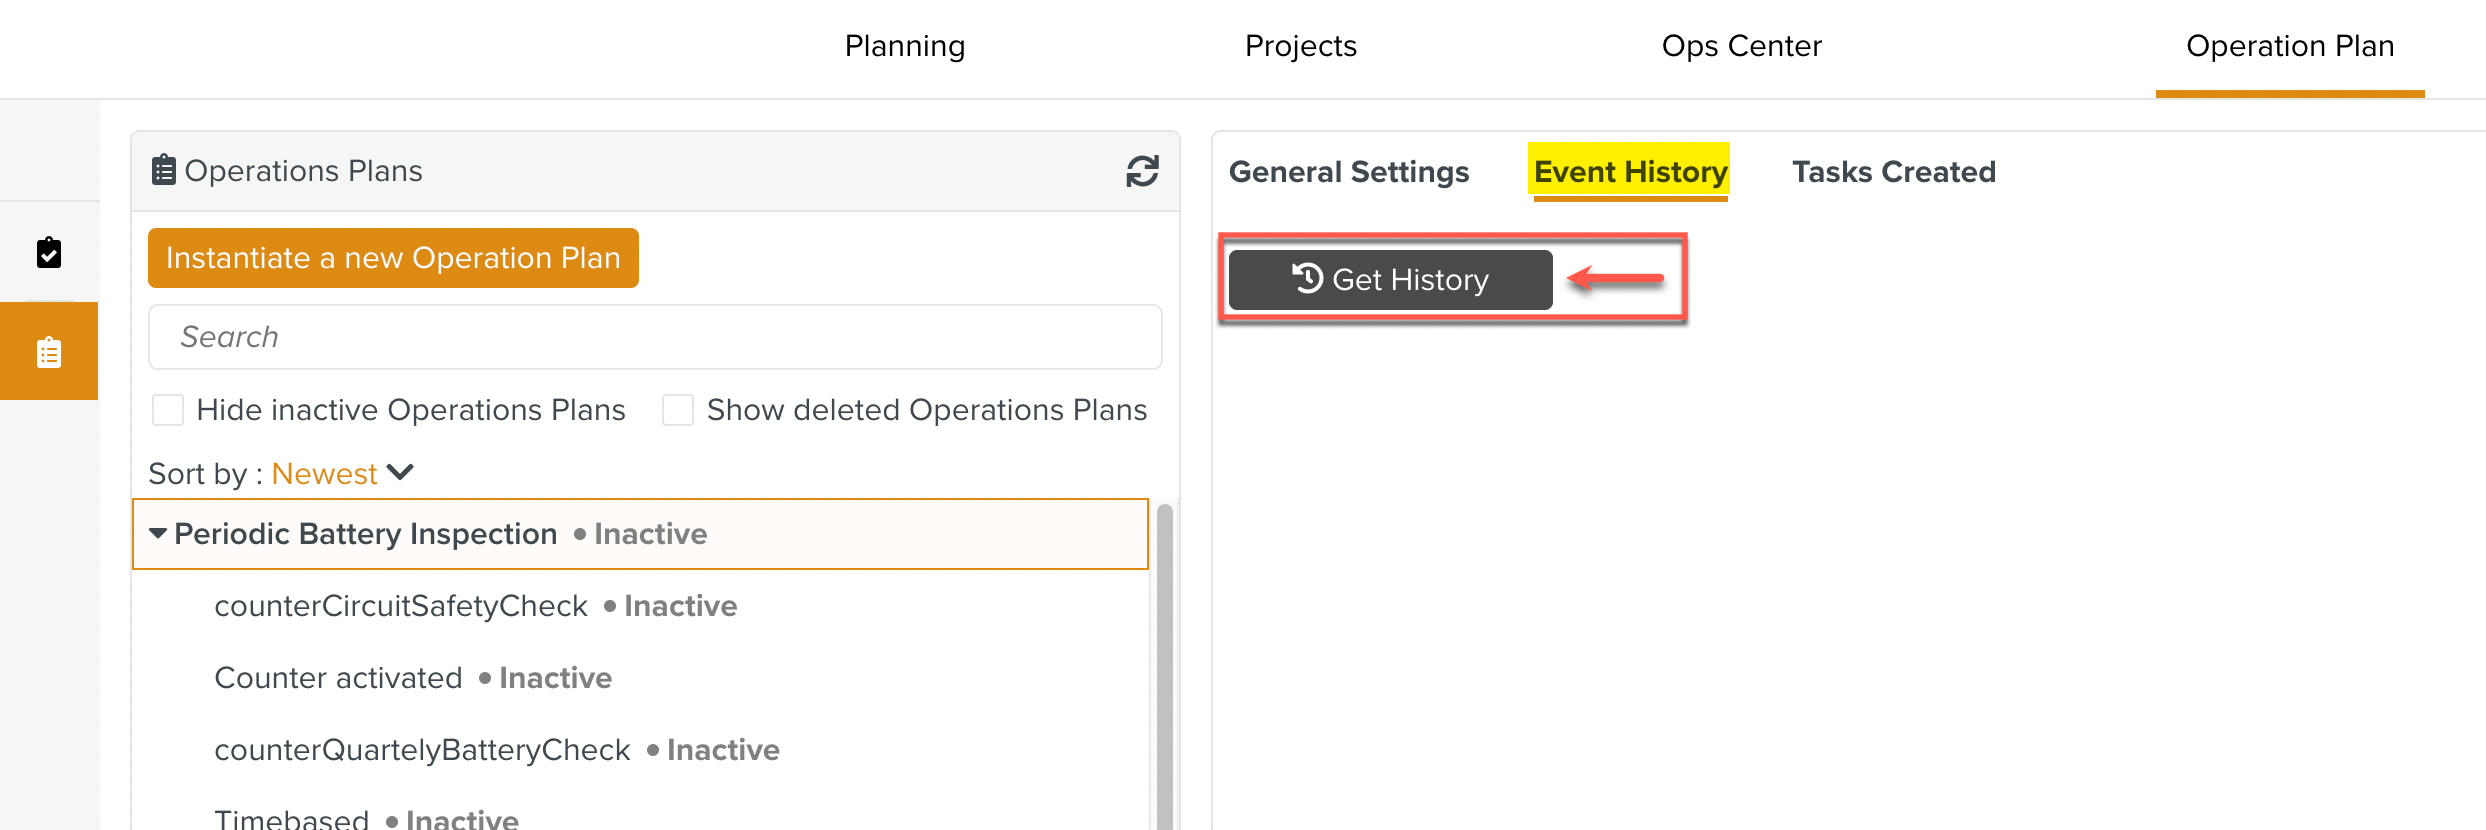
The Event History log is displayed as seen below.
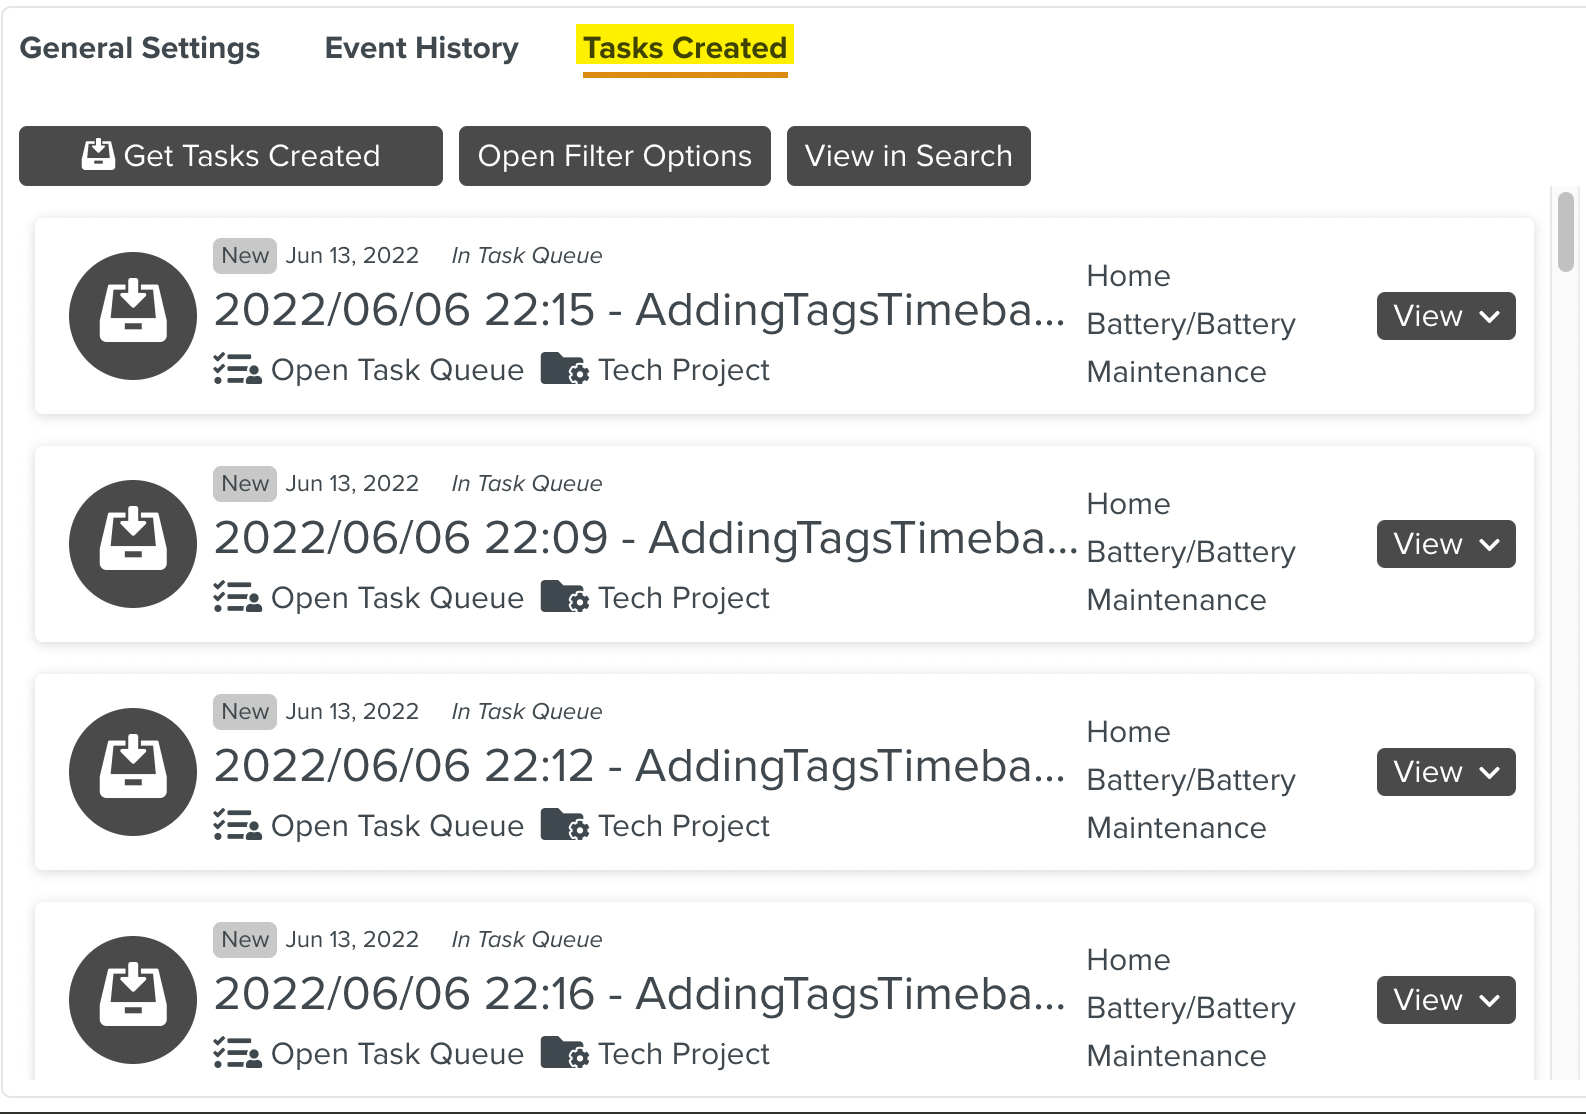
The tab lists all the Tasks that were created as Actions of this Operation Plan Execution.
To view the Tasks created by this Operation Plan Execution:
In the tab, click .

The Tasks created as part of the Actions of this Operation Plan Execution are listed below.
 |
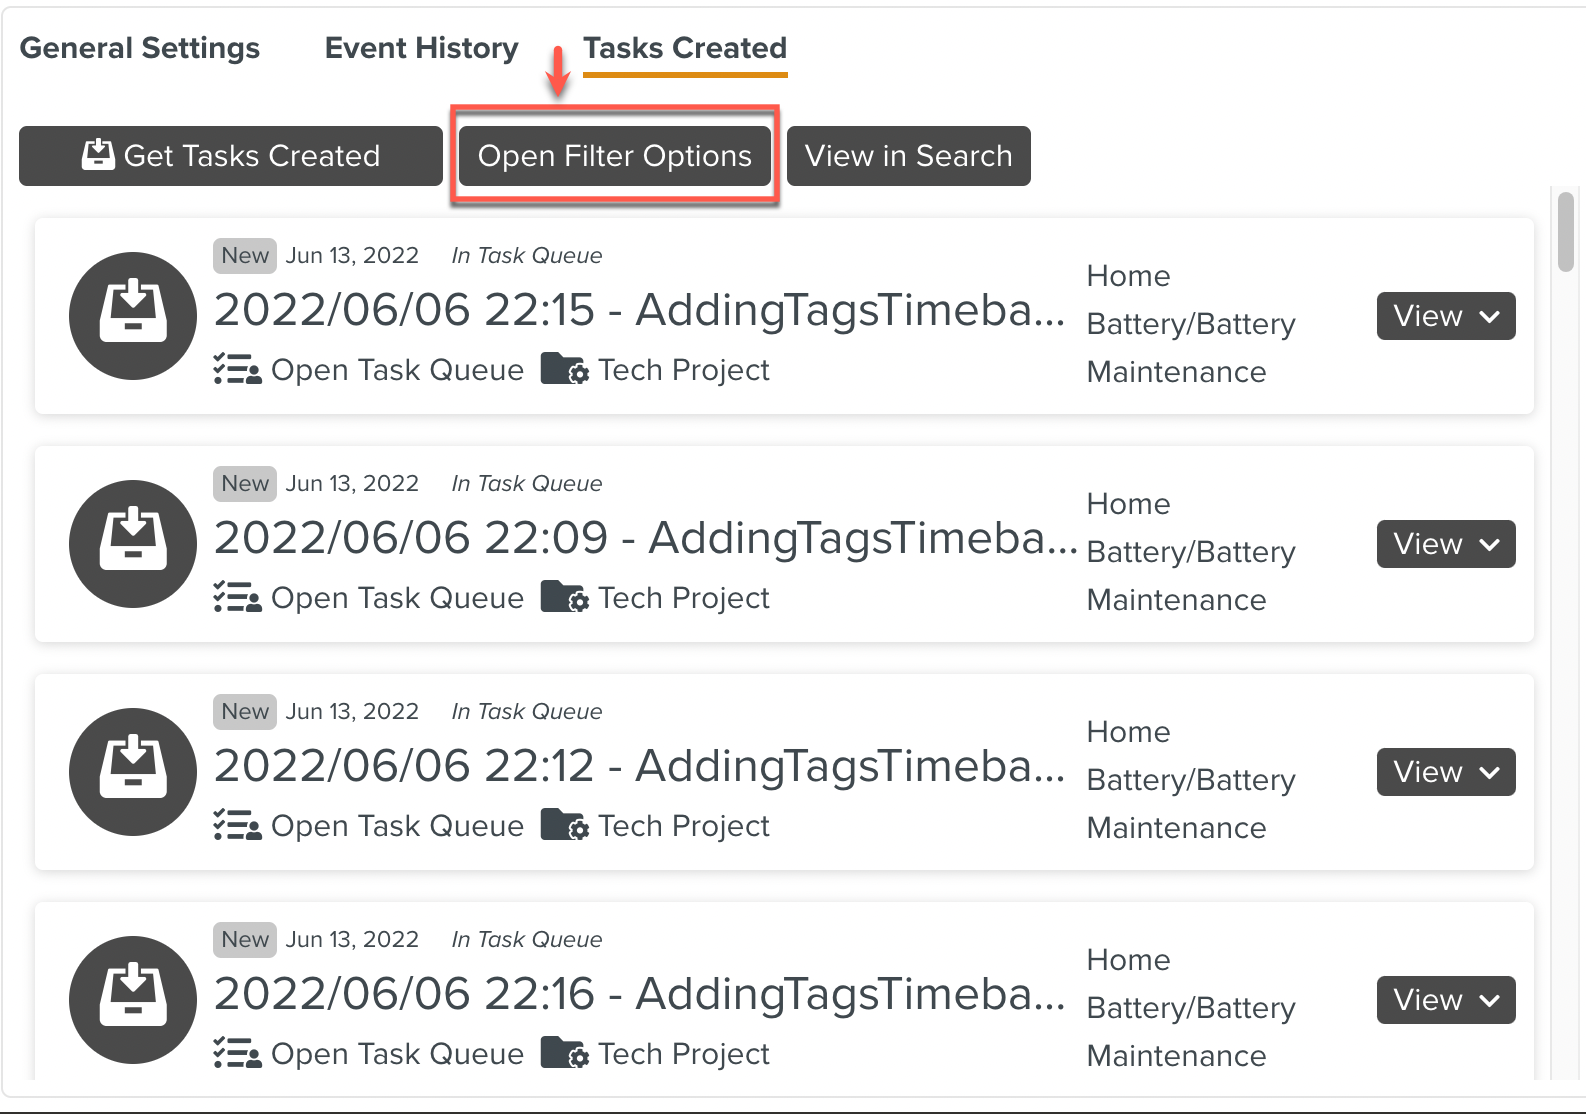
You can filter the Tasks to view those that are of interest. To set the filter options, click .
 |
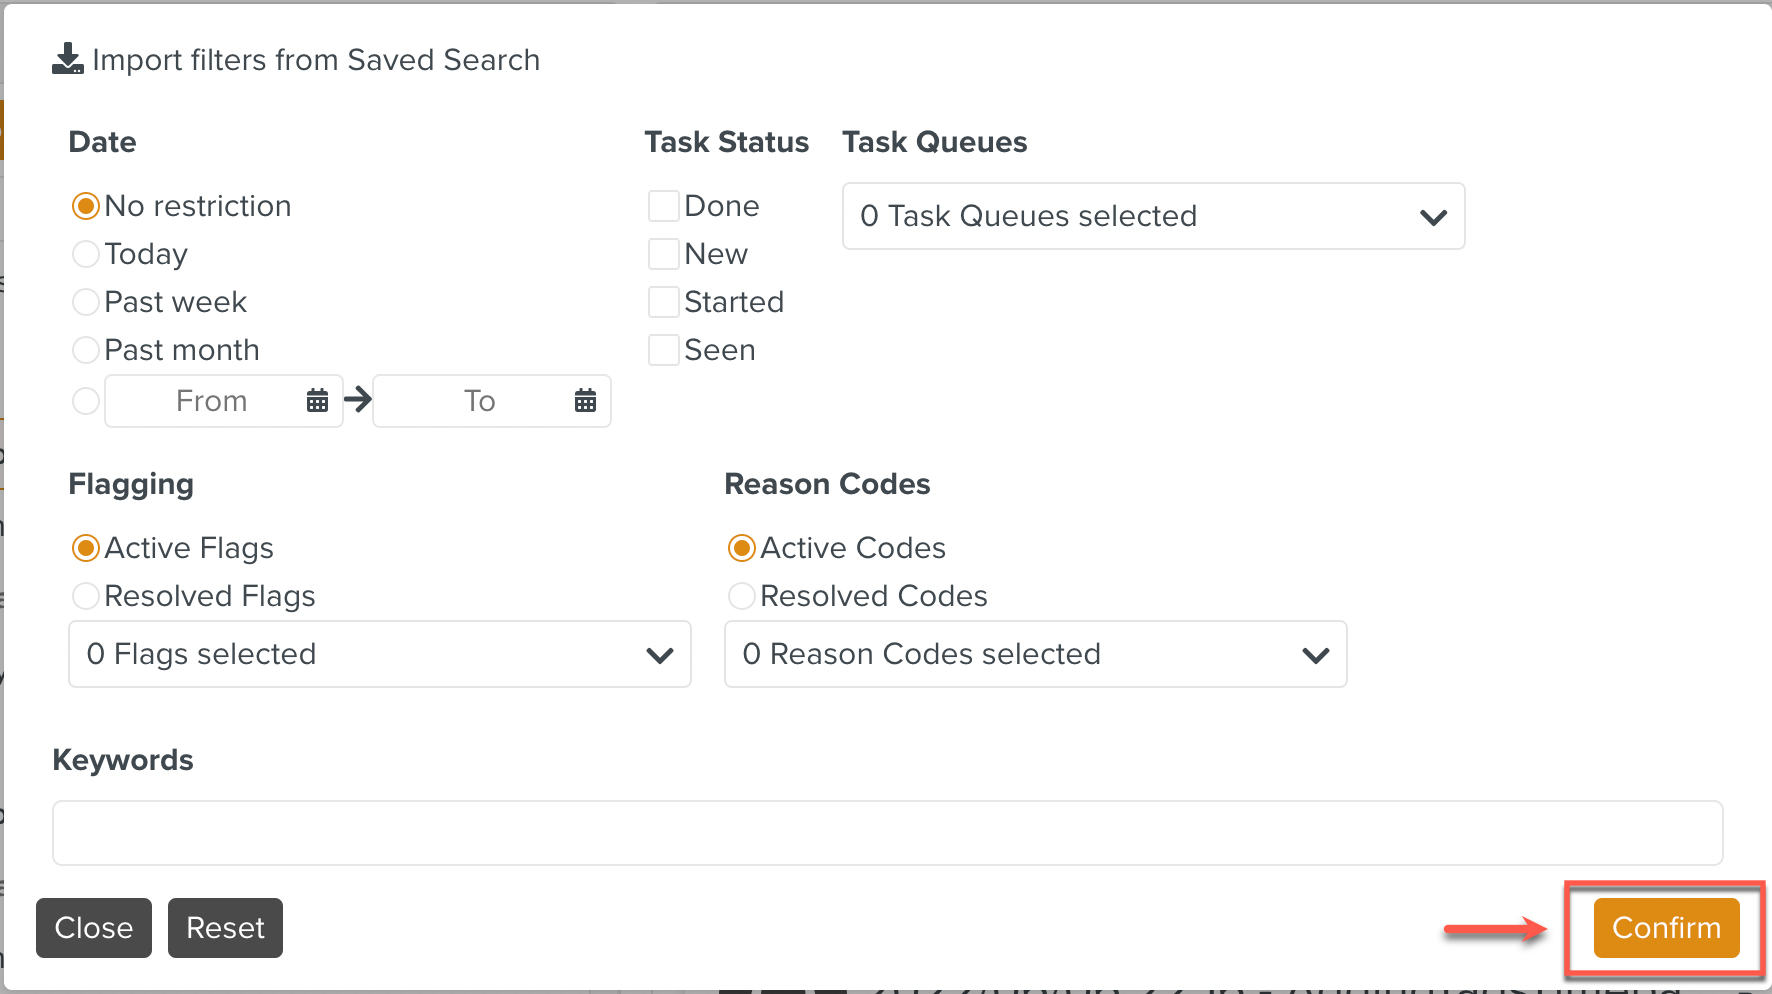
You can choose to filter the Tasks based on Date, Flagging, Task Status, Task Queues, Reason Codes or Keywords. Click to apply the filter.
All the Counters within an Operation Plan Execution log their execution information as well.
Click on any Counter to see the execution information of the counter.
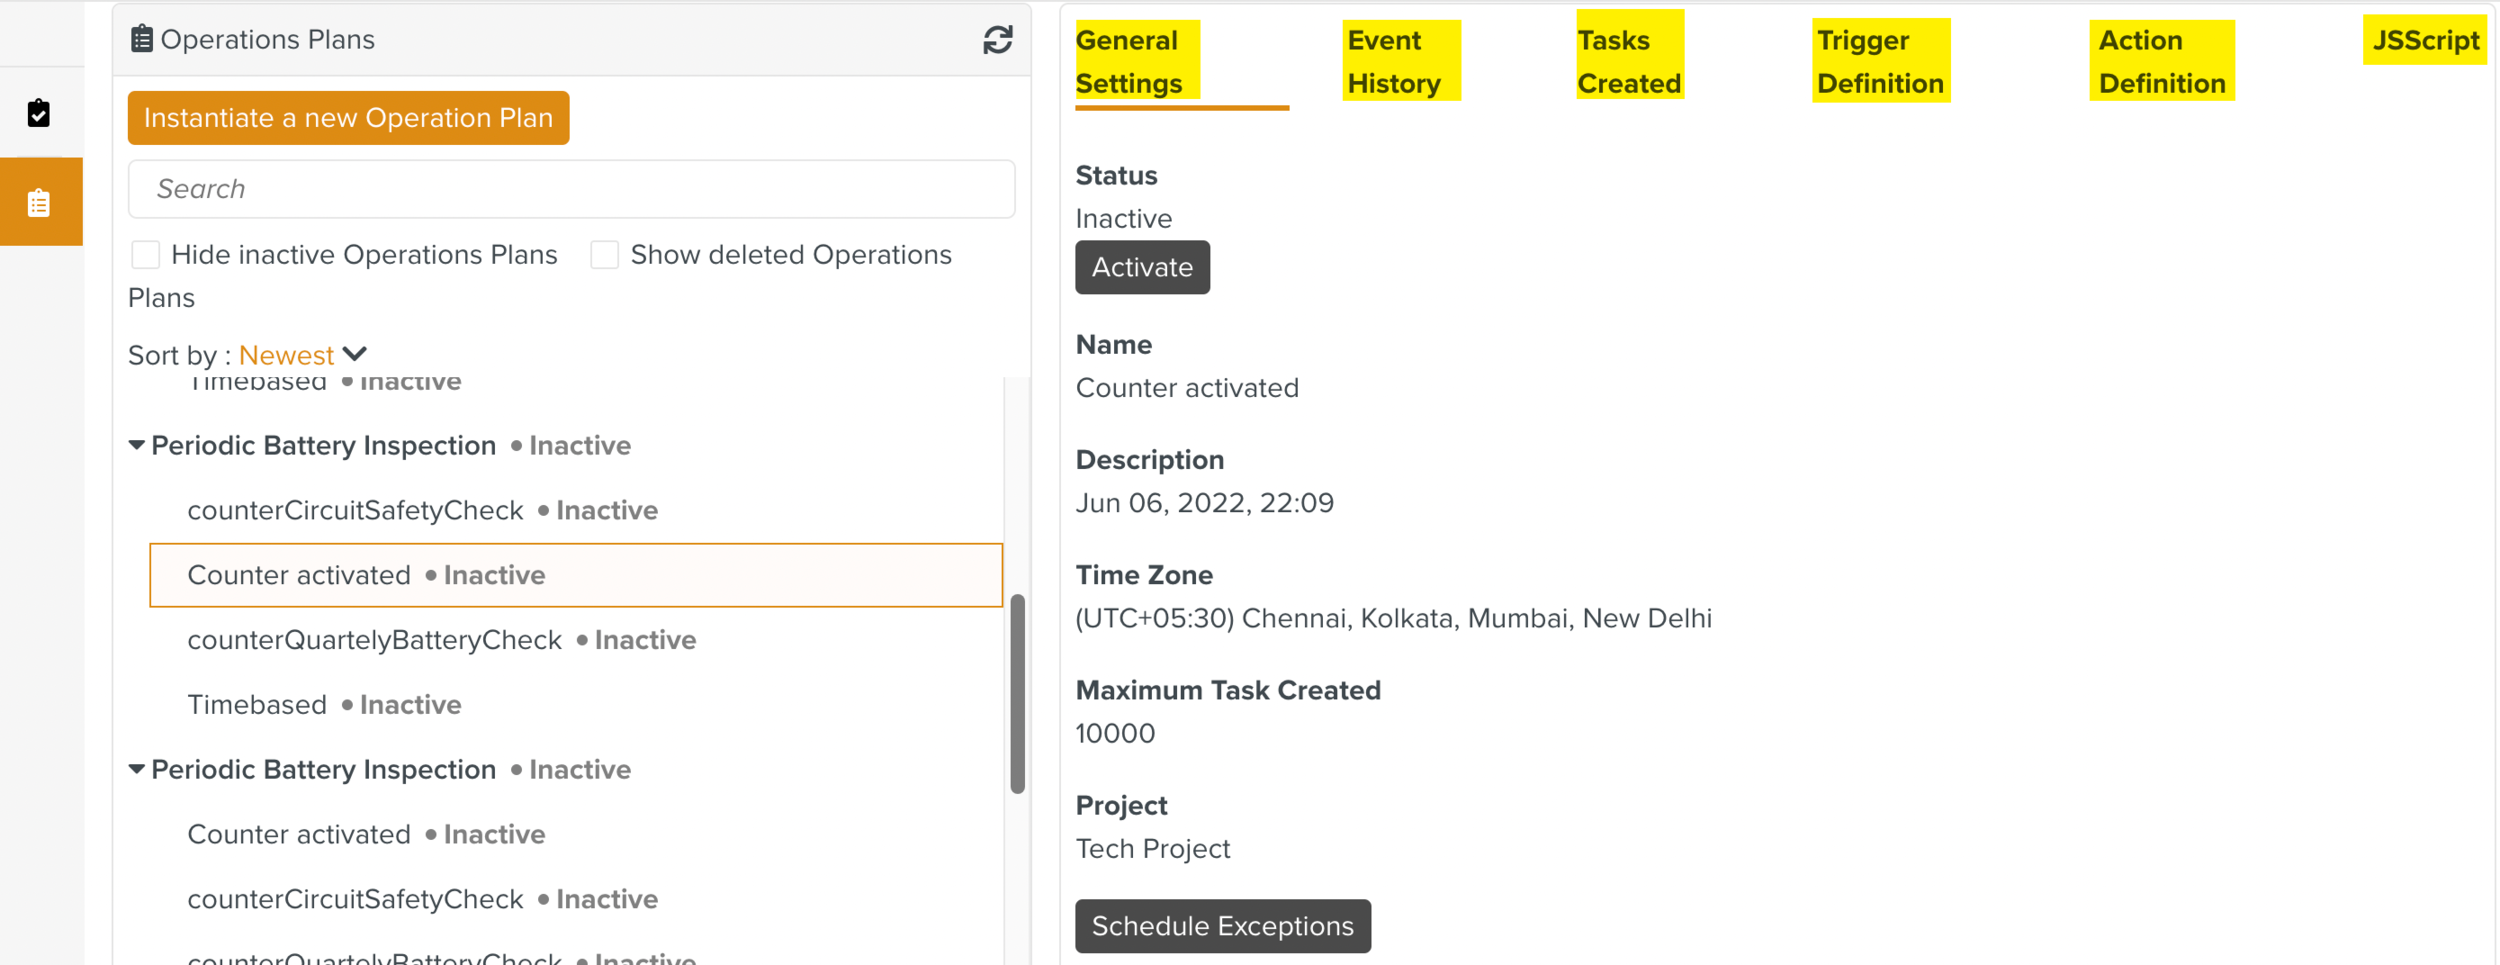
There are six tabs as follows:
Tabs | Description |
|---|---|
1. General Settings | Contains the status and general information about the Counter. |
2. Event Triggers | Logs the Event Triggers of the Counter that have been triggered. |
3. Tasks Created | Logs the Tasks created as part of the Action of the Counter. |
4. Trigger Definition | Contains the Event Trigger defined in the Counter. |
5. Action Definition | Contains the Action defined in the Counter. |
6. JS Script | Contains the JS Script if the Counter includes a JS Script. |