Using the Incident Dashboard
Note
You must have appropriate Access Rights to use the Incident Dashboard.
The Incident Dashboard displays all Incidents raised in the system. It has two tabs as shown below.
Incidents - Displays the Incidents raised and their current State.
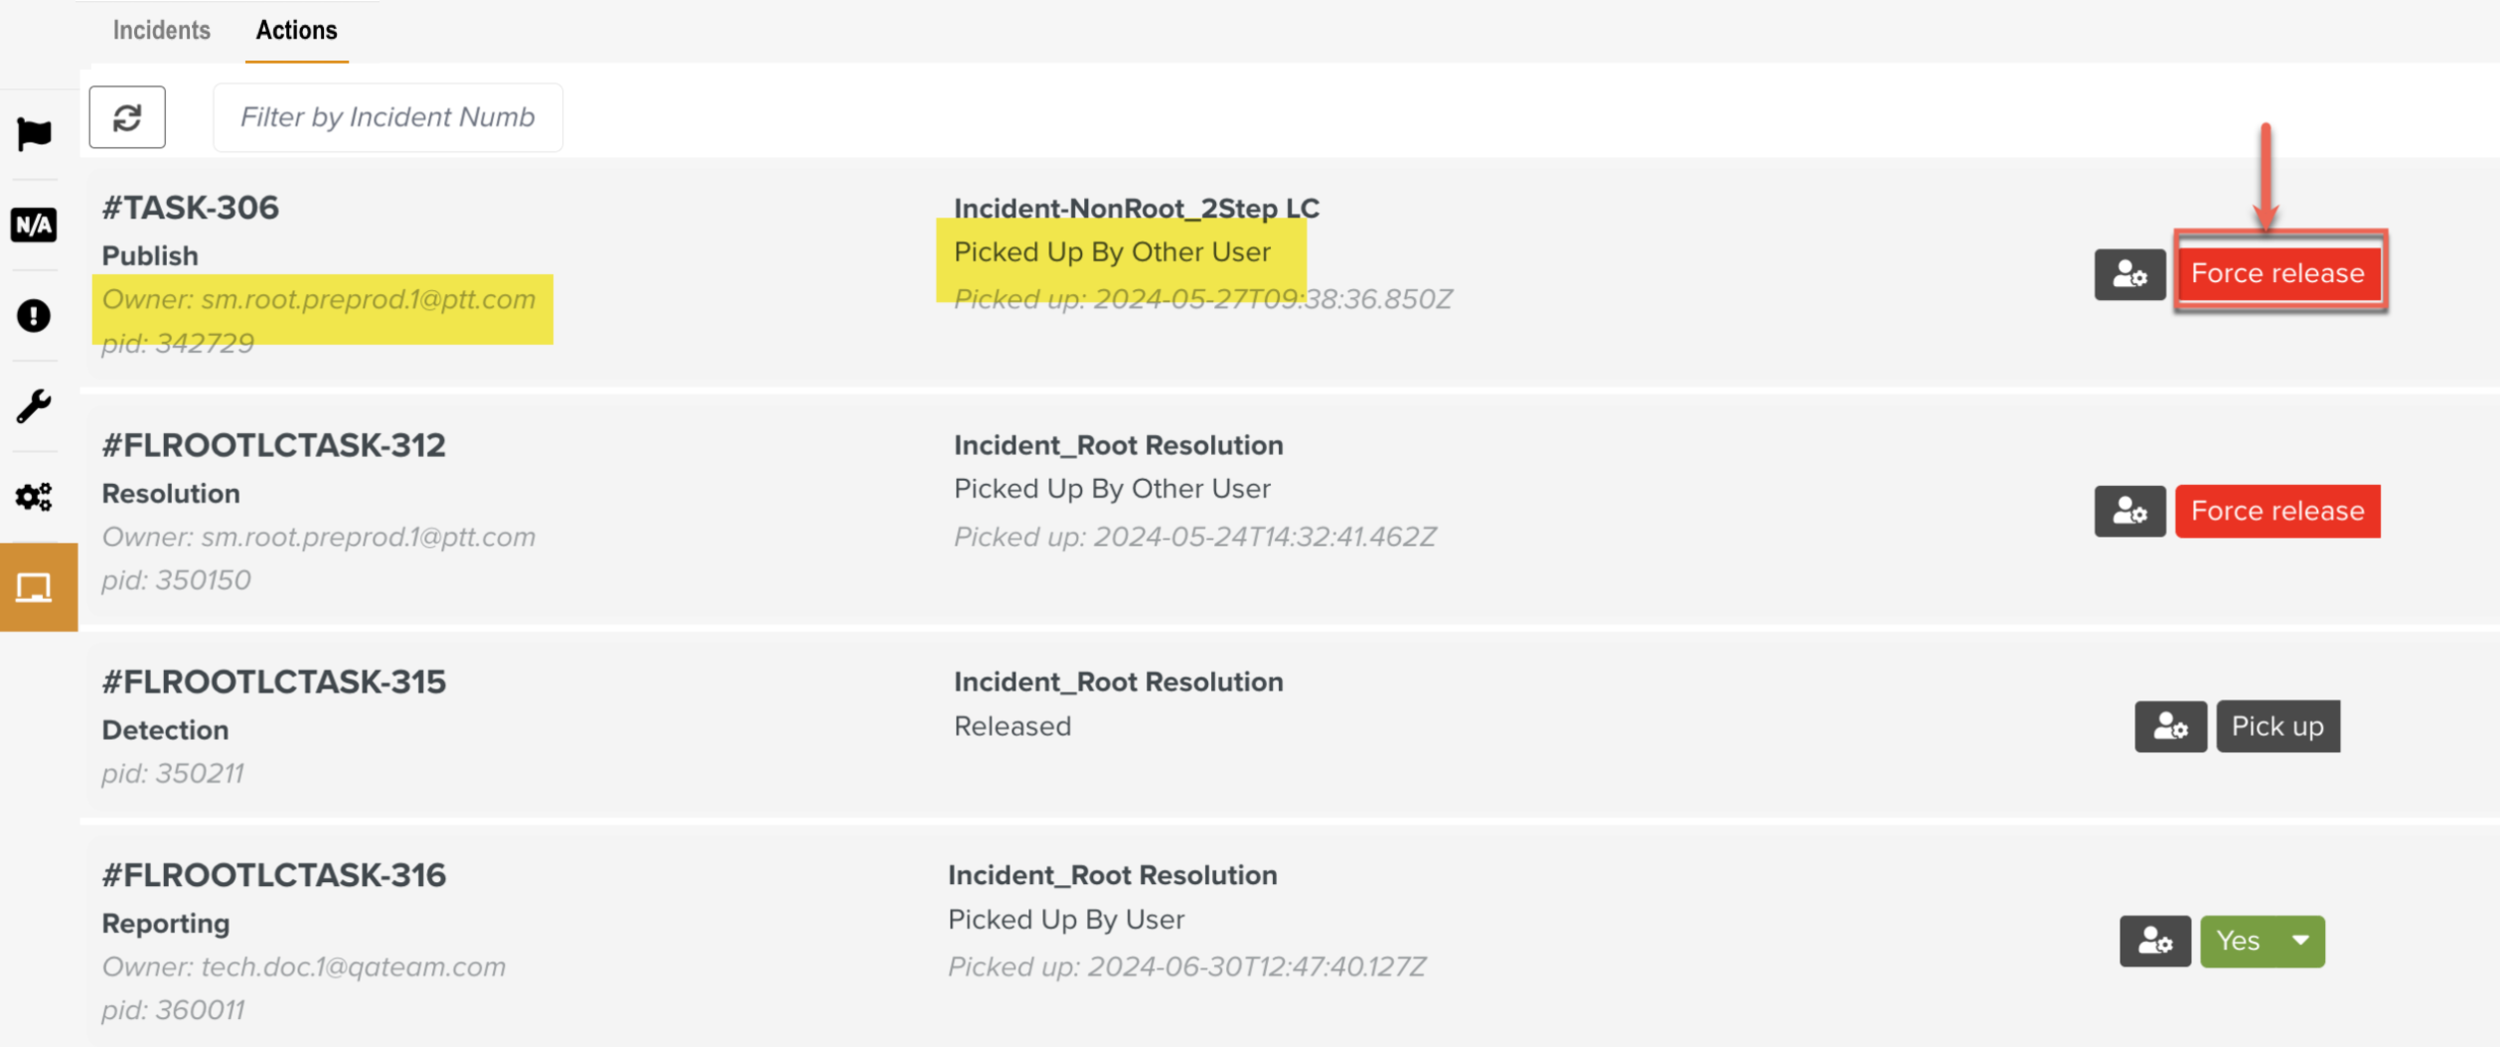
Actions - Displays the next available action on the raised Incidents.
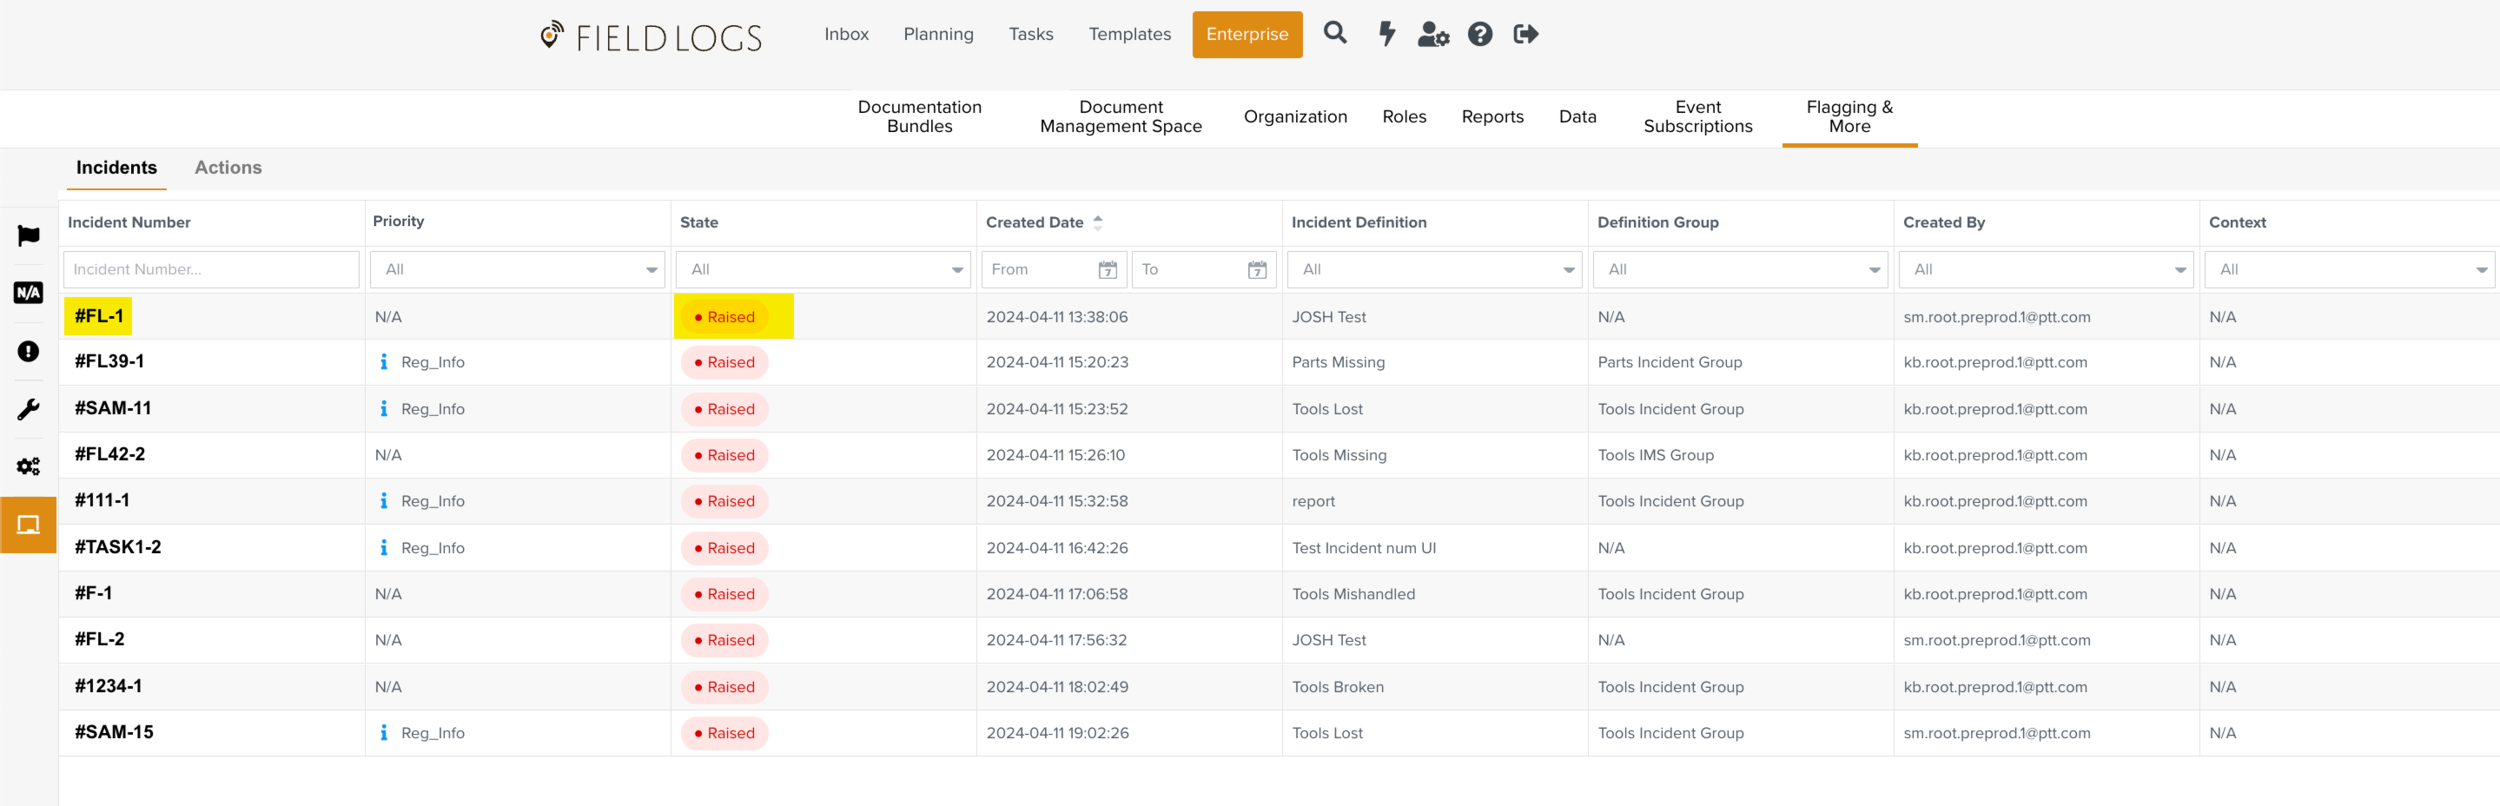
In the tab Incidents, you can view the list of all the Incidents raised.
You can search Incidents based on the criteria below.
Incident Number
Priority
State
Created Date
Incident Definition
Definition group
Created by
Context
Task Name
Project
 |
Below are a few examples based on specified criteria:
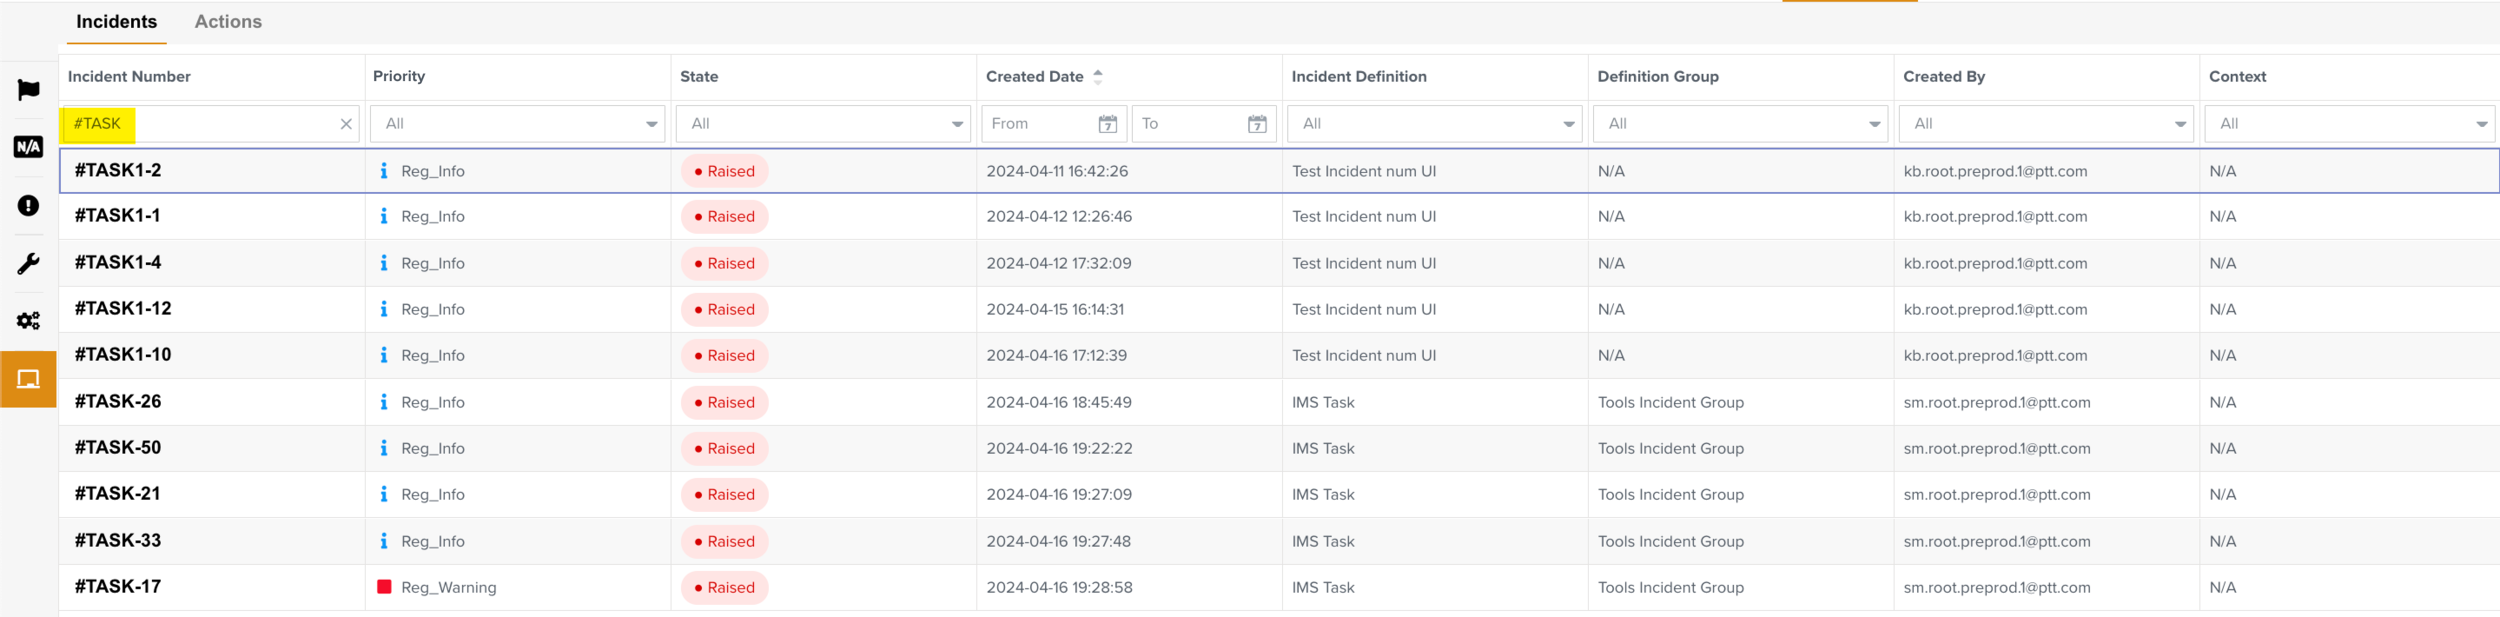
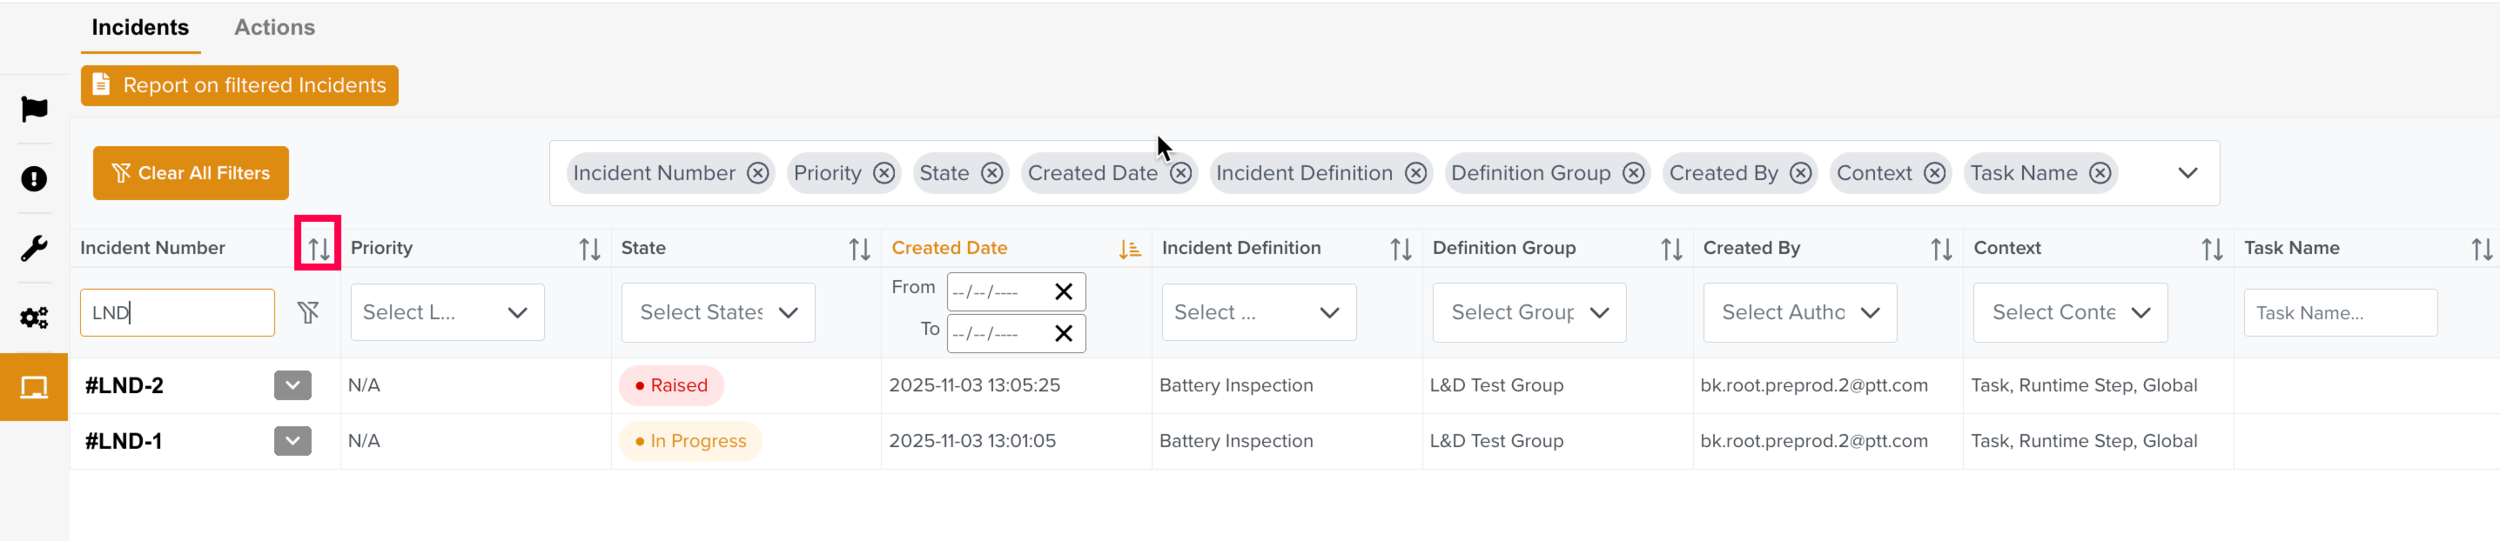
Incident Number: In the below example, all the Incidents with the text LND as a part of their Incident numbers are filtered.
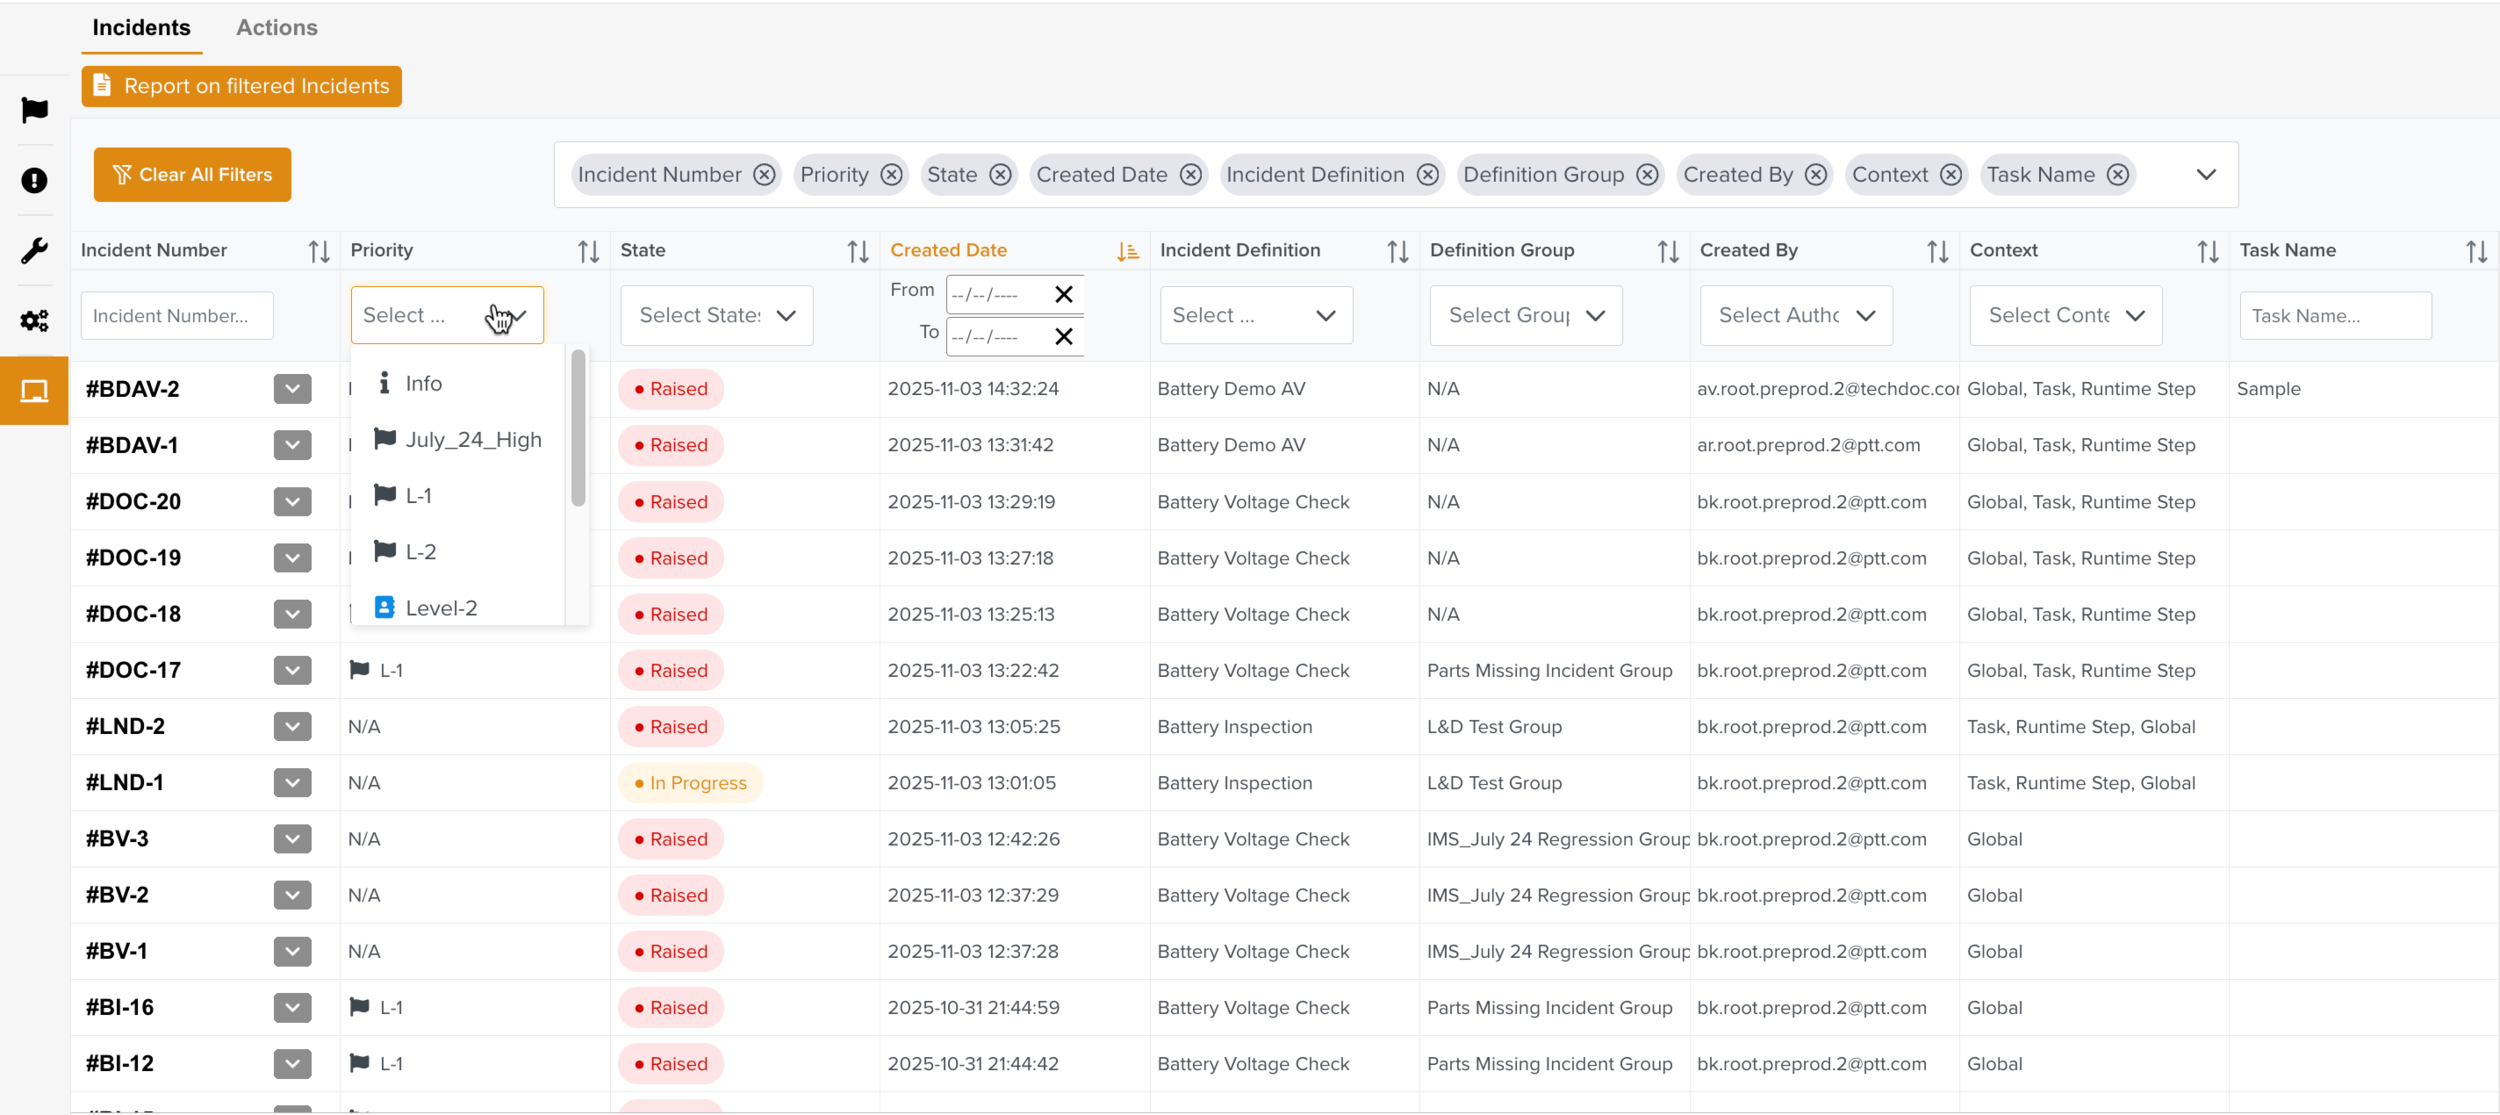
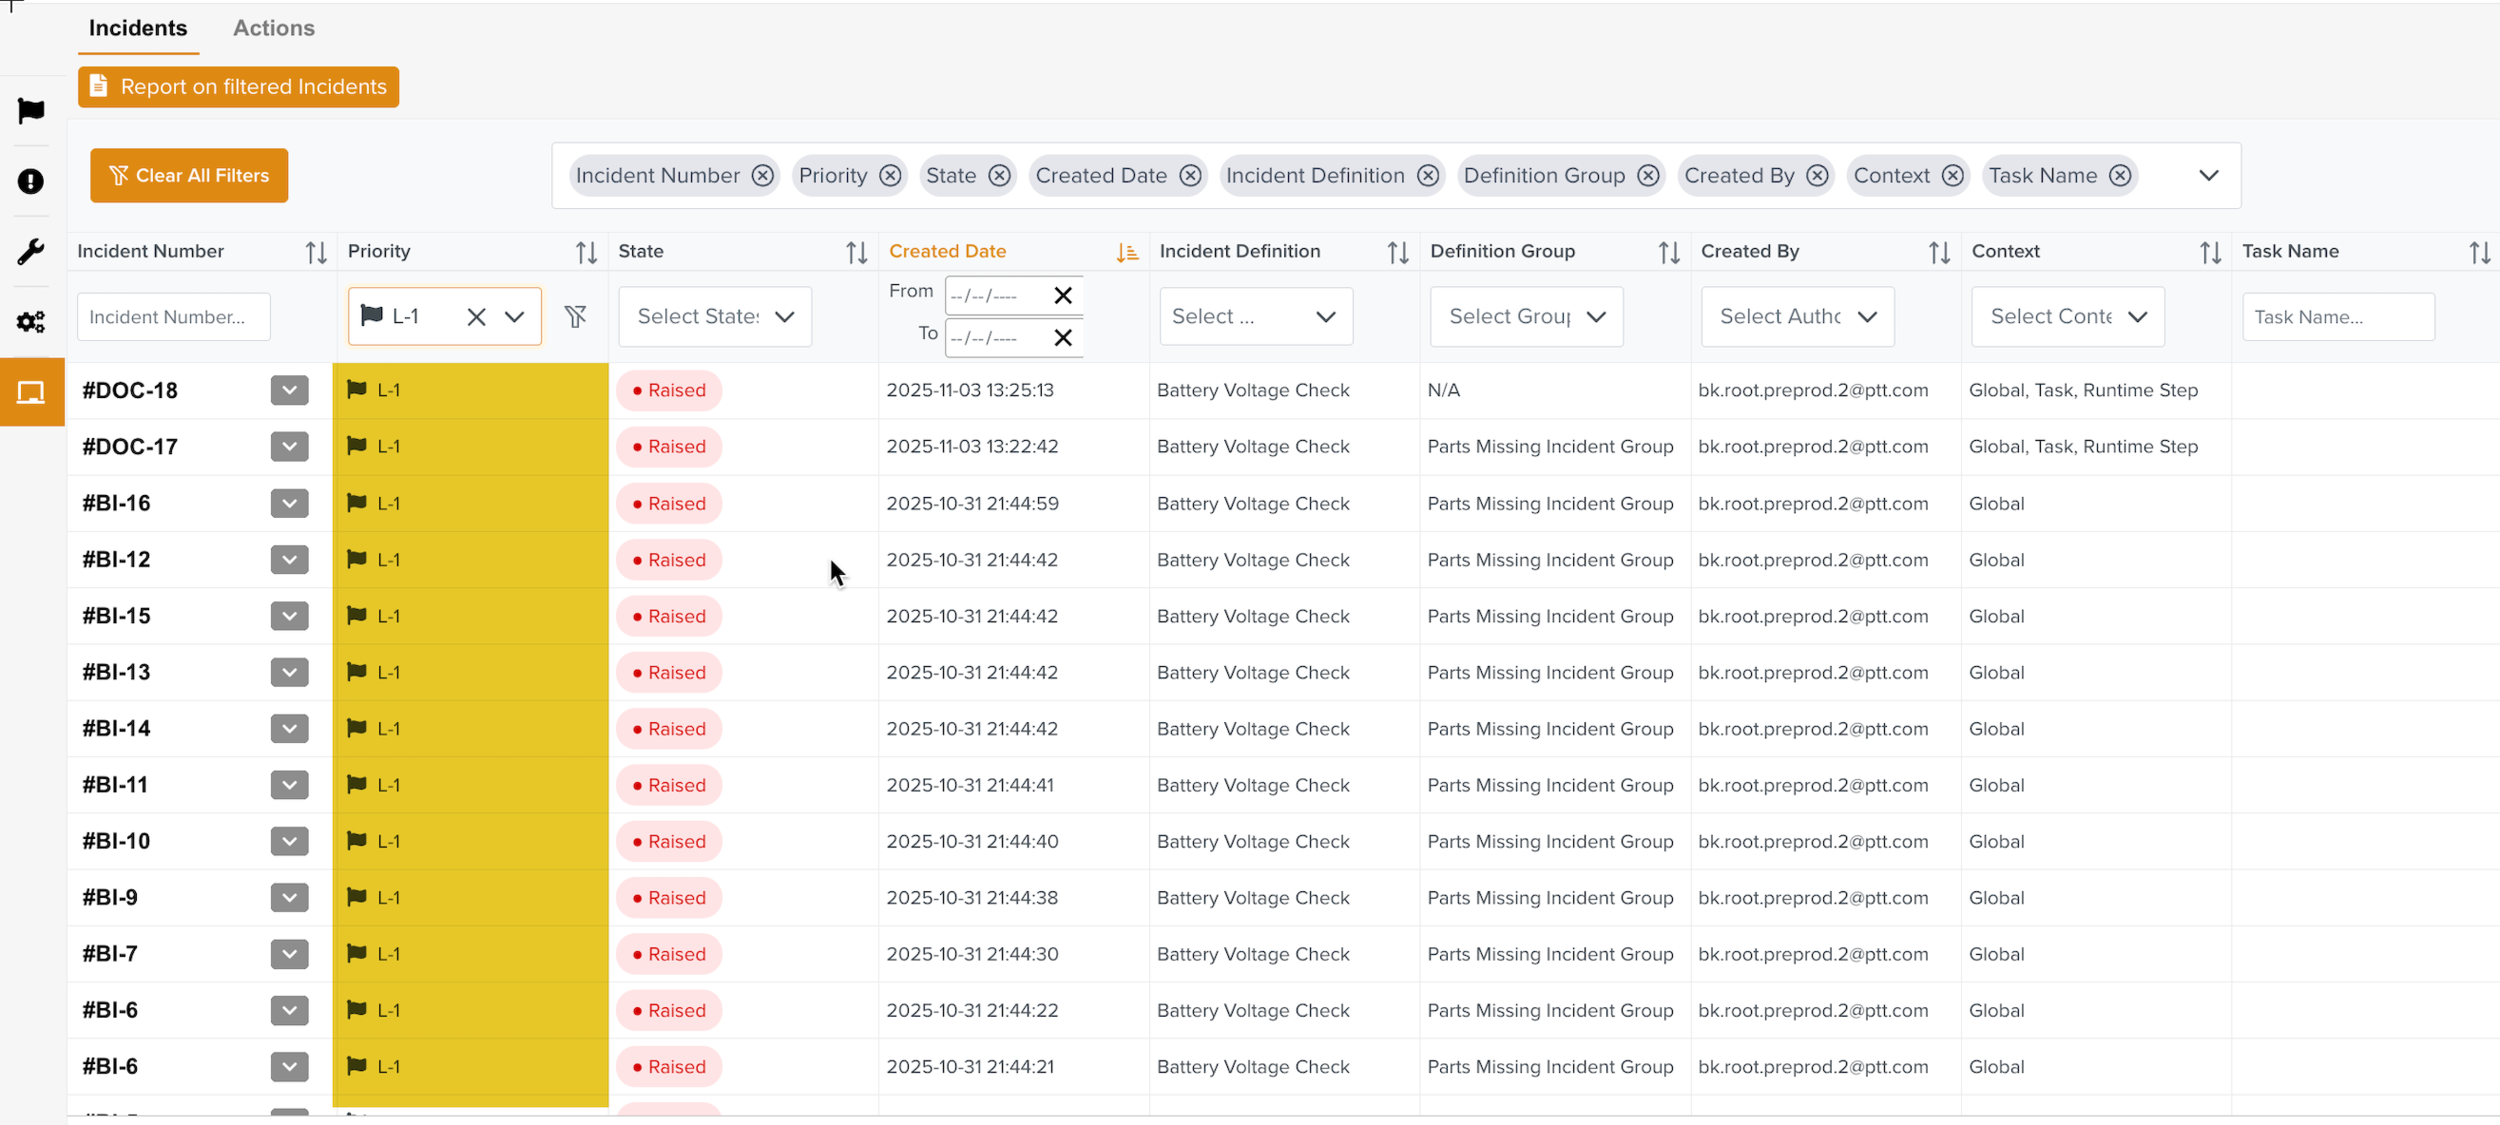
Priority: In the below example, all the Incidents of Priority L-1 are filtered.
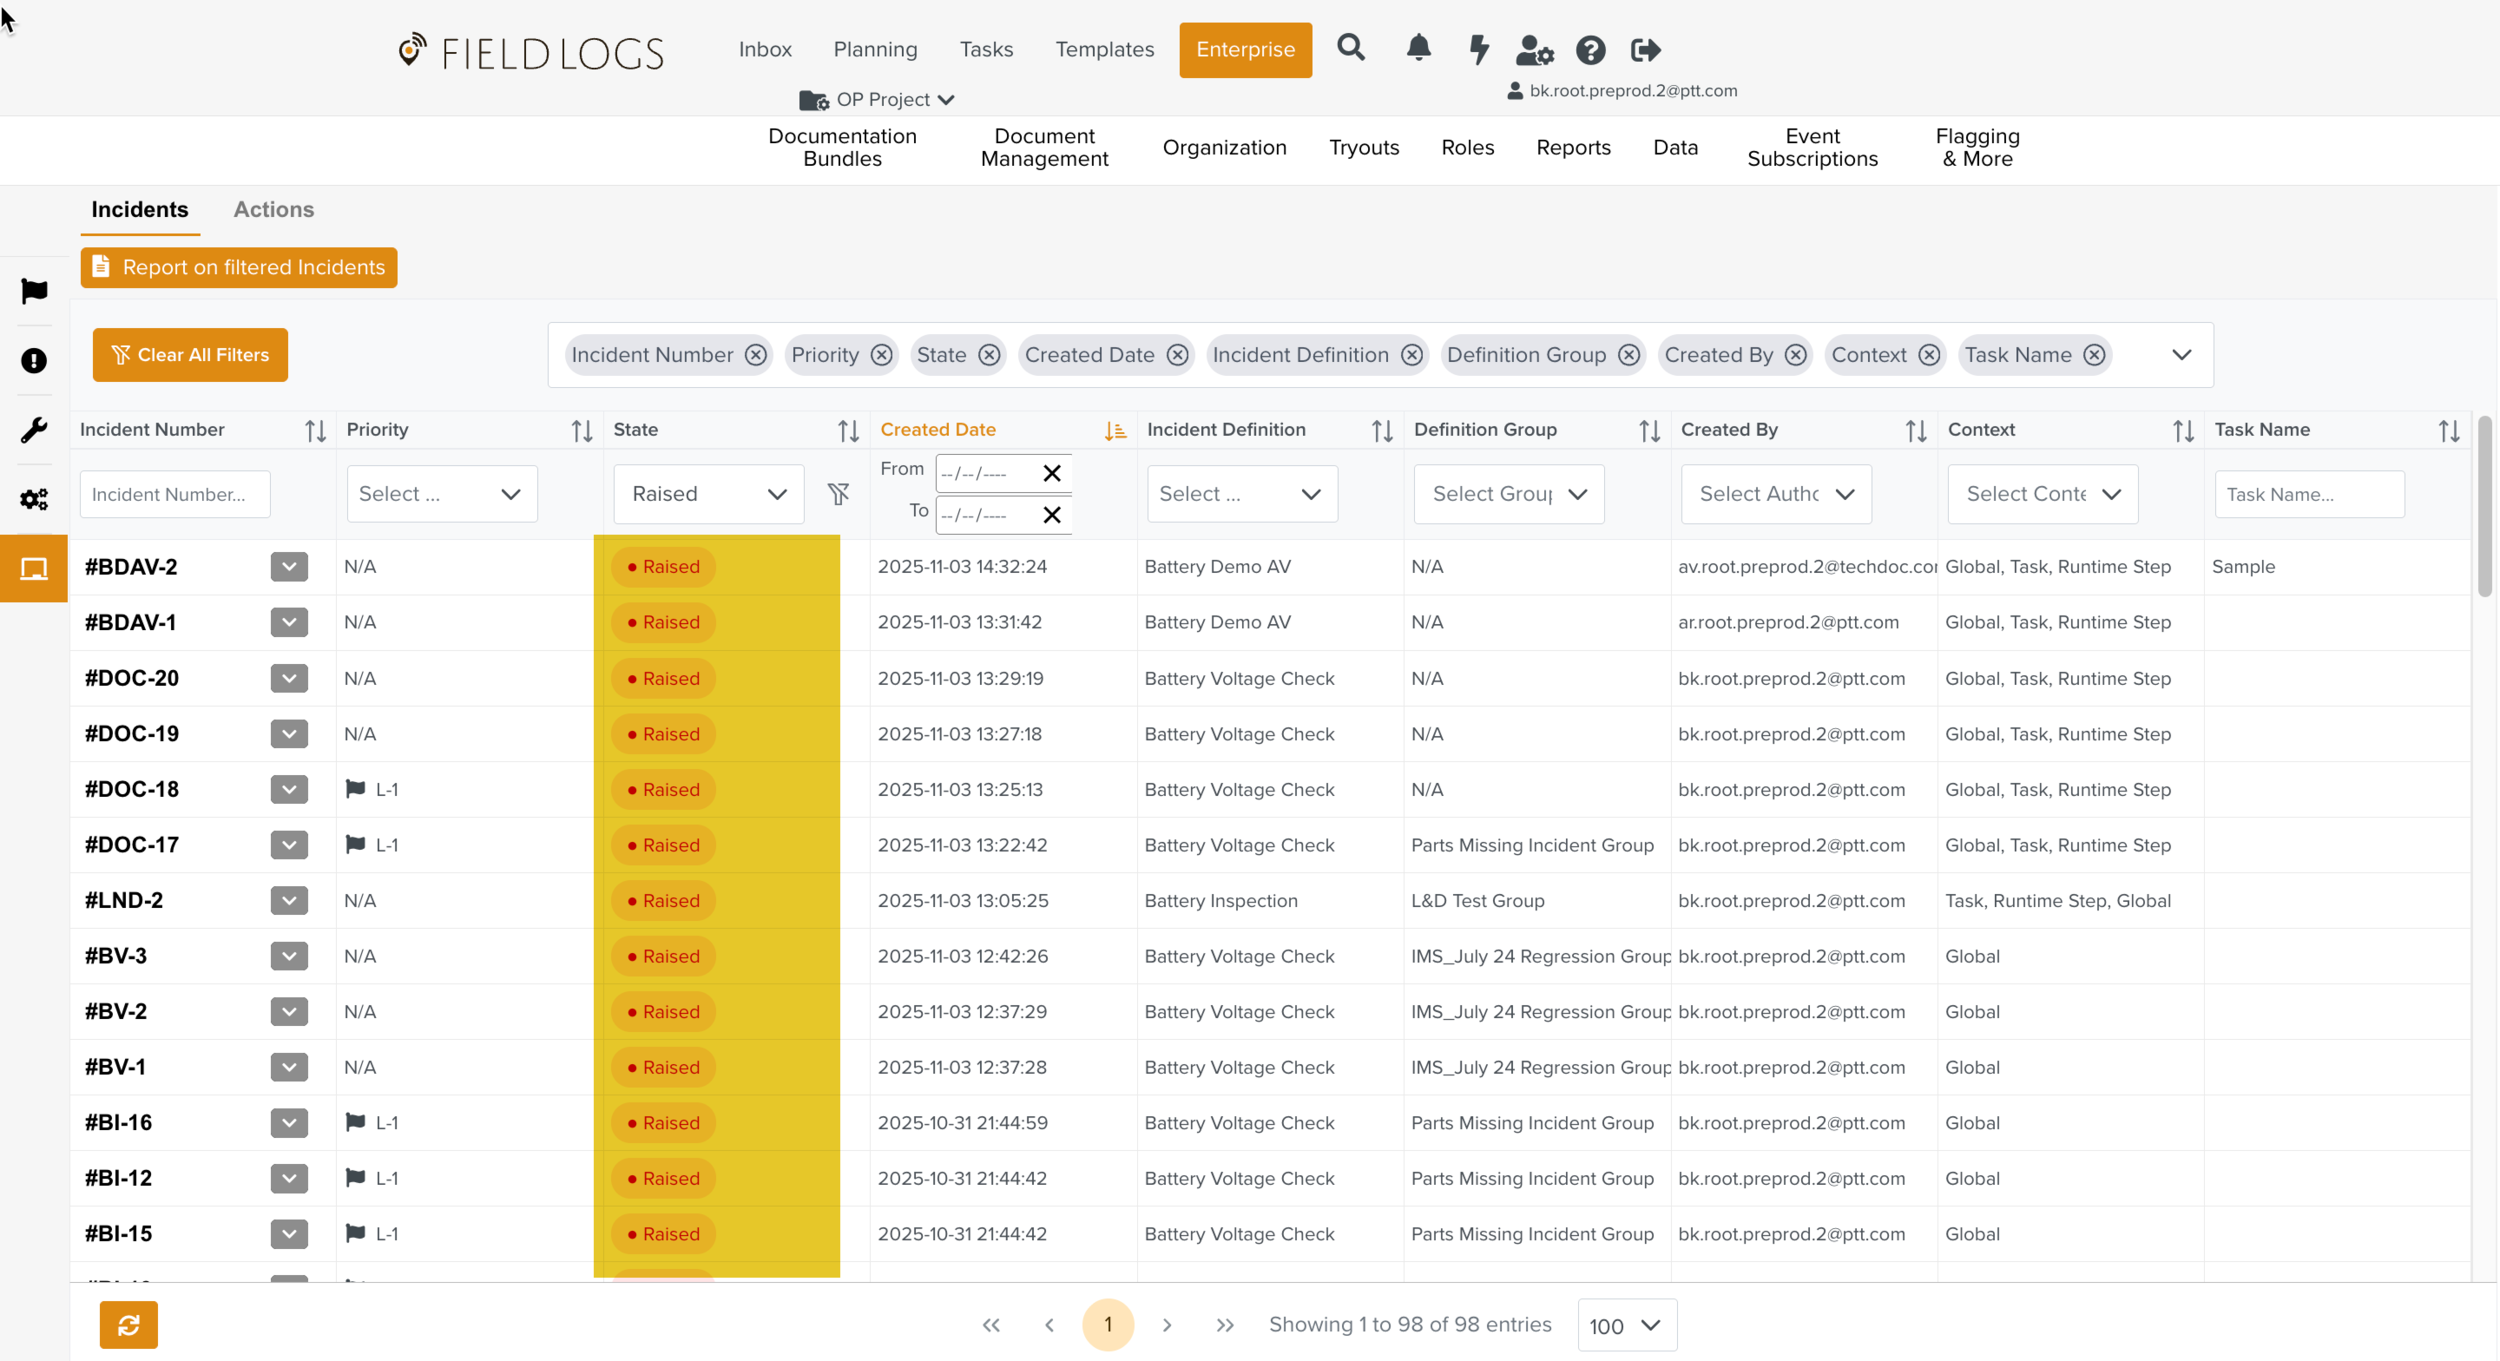
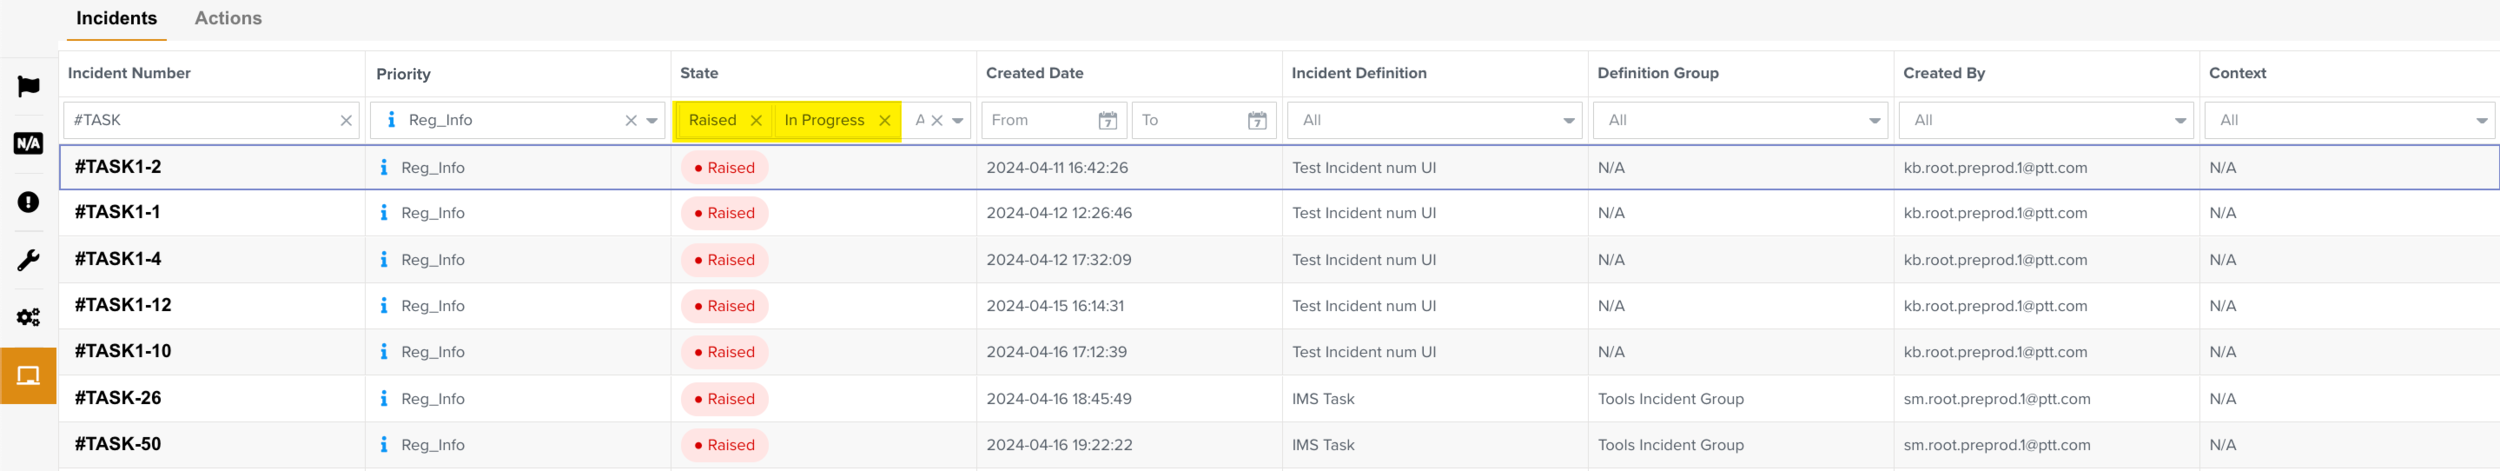
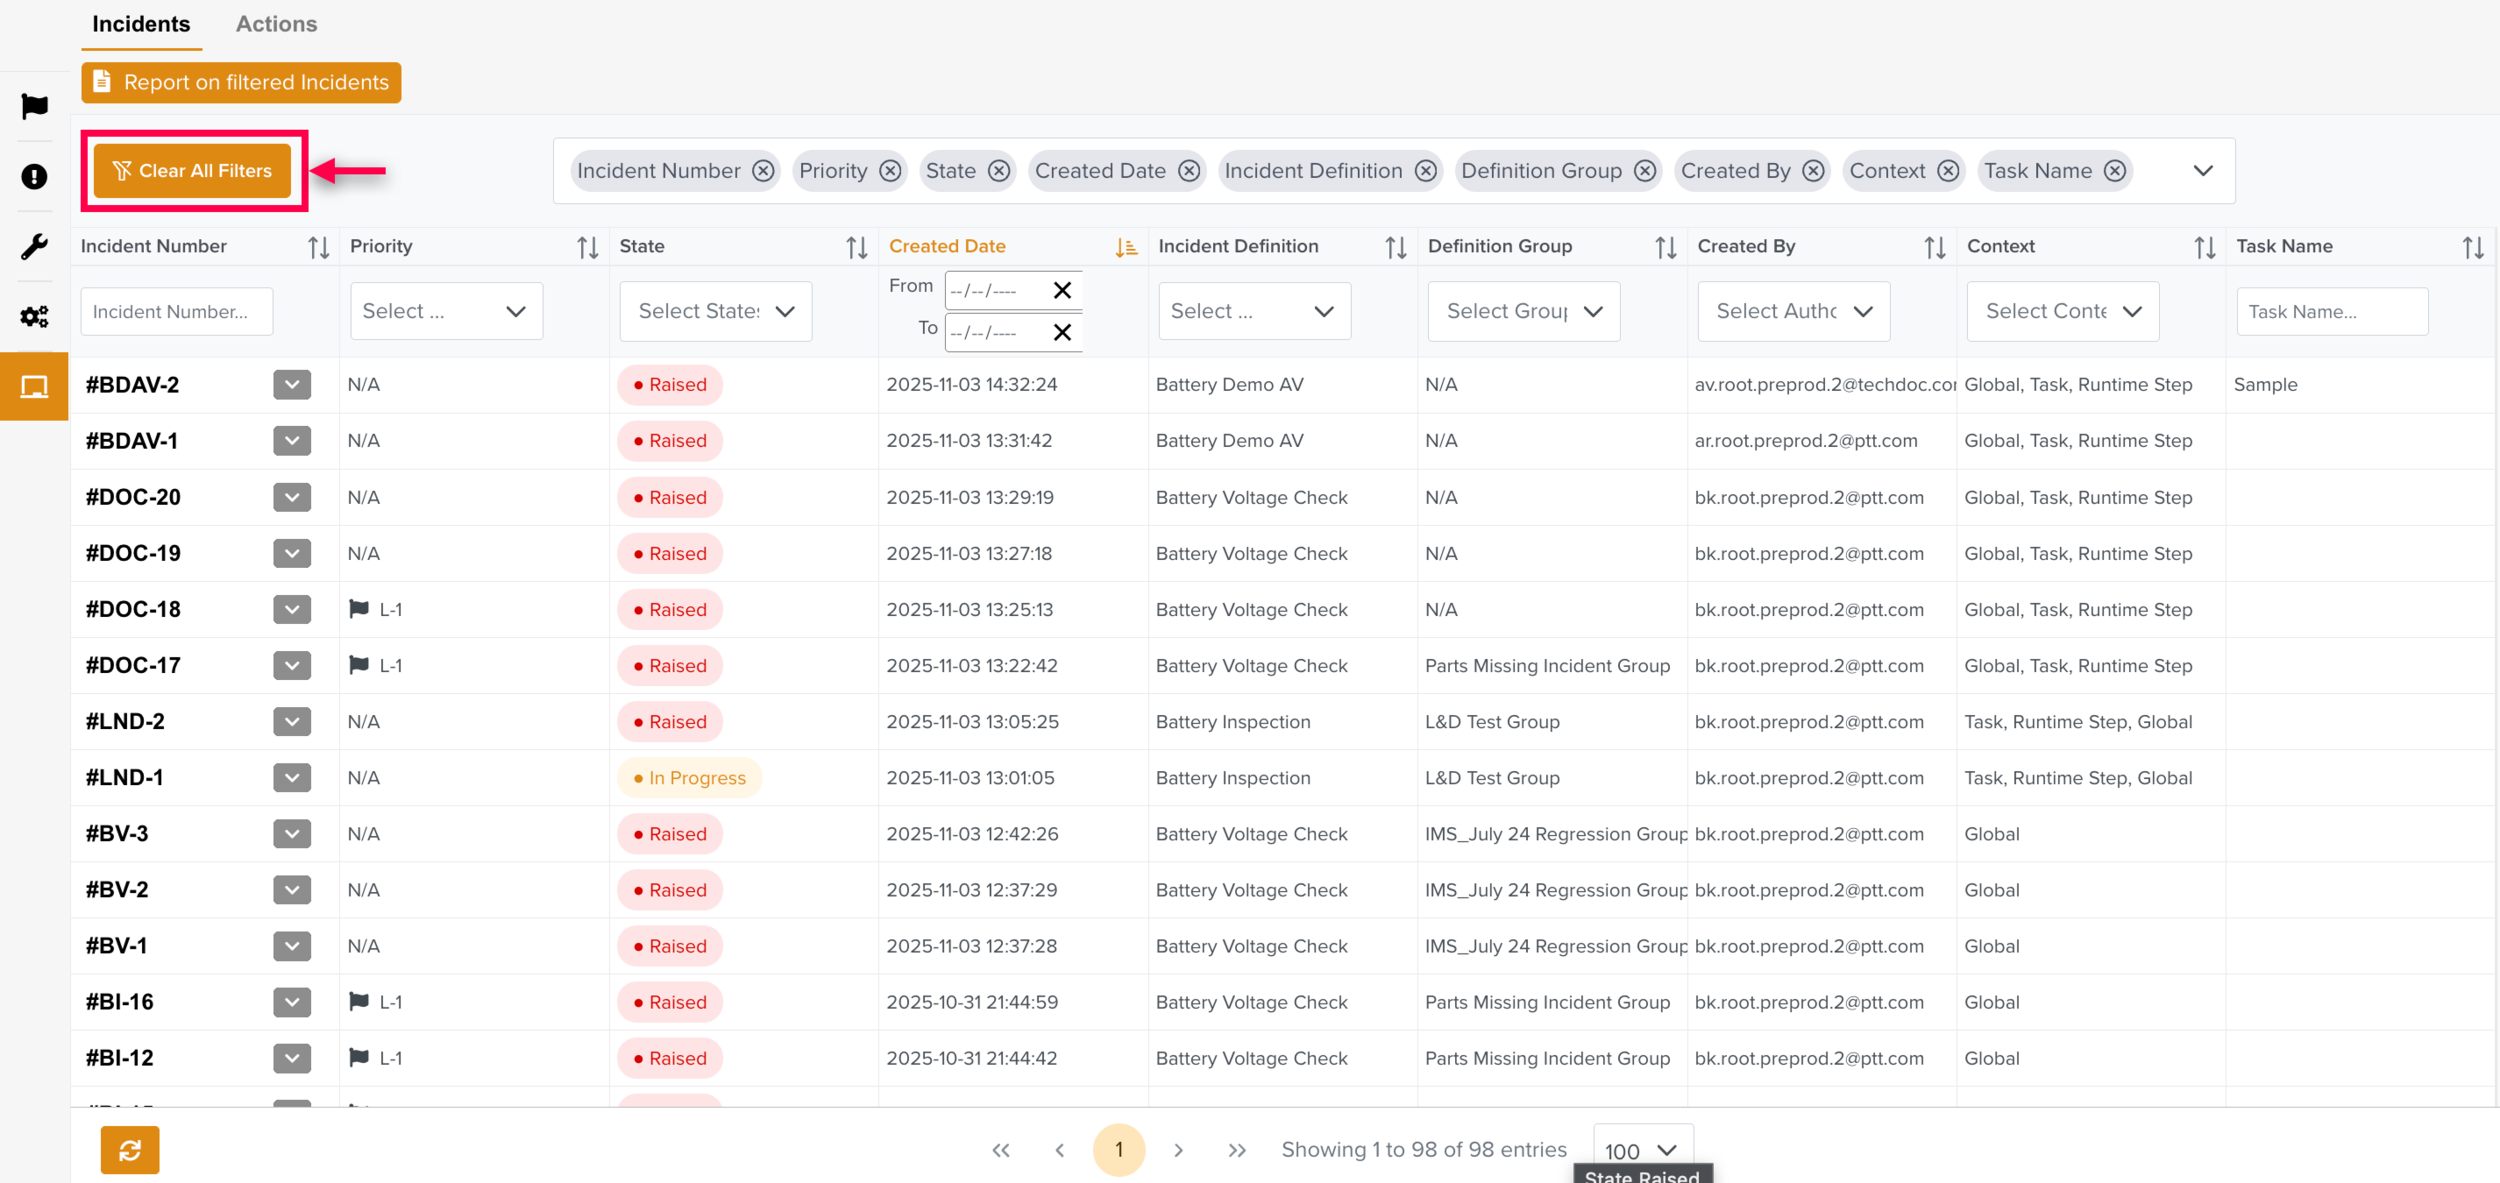
State: In the below example, all the Incidents with the State Raised are filtered.
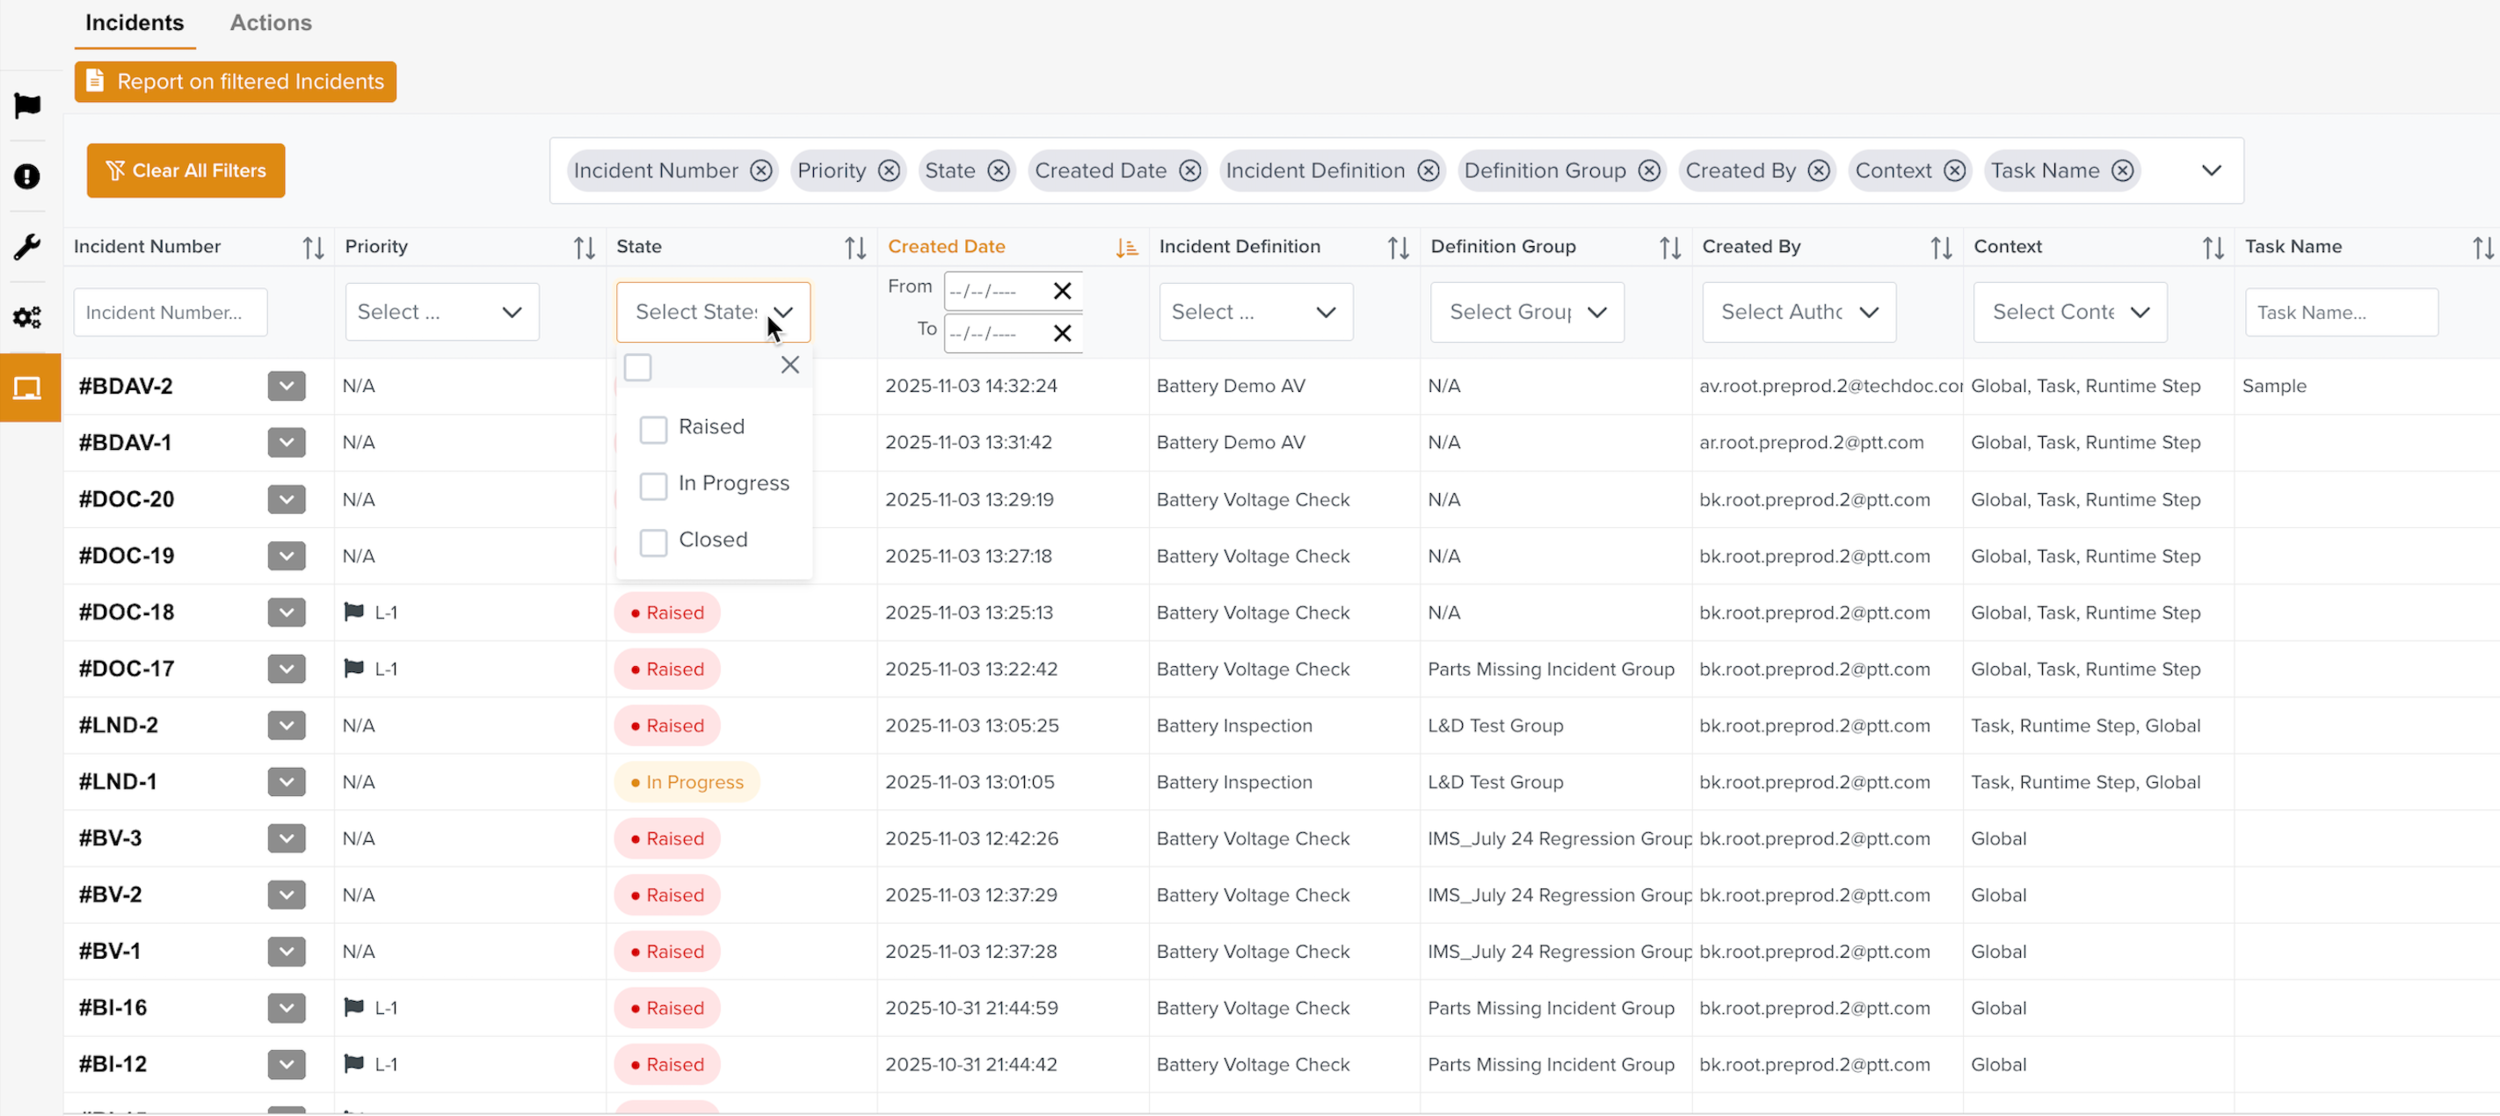
In the following example, the State can also be searched by selecting multiple State options.
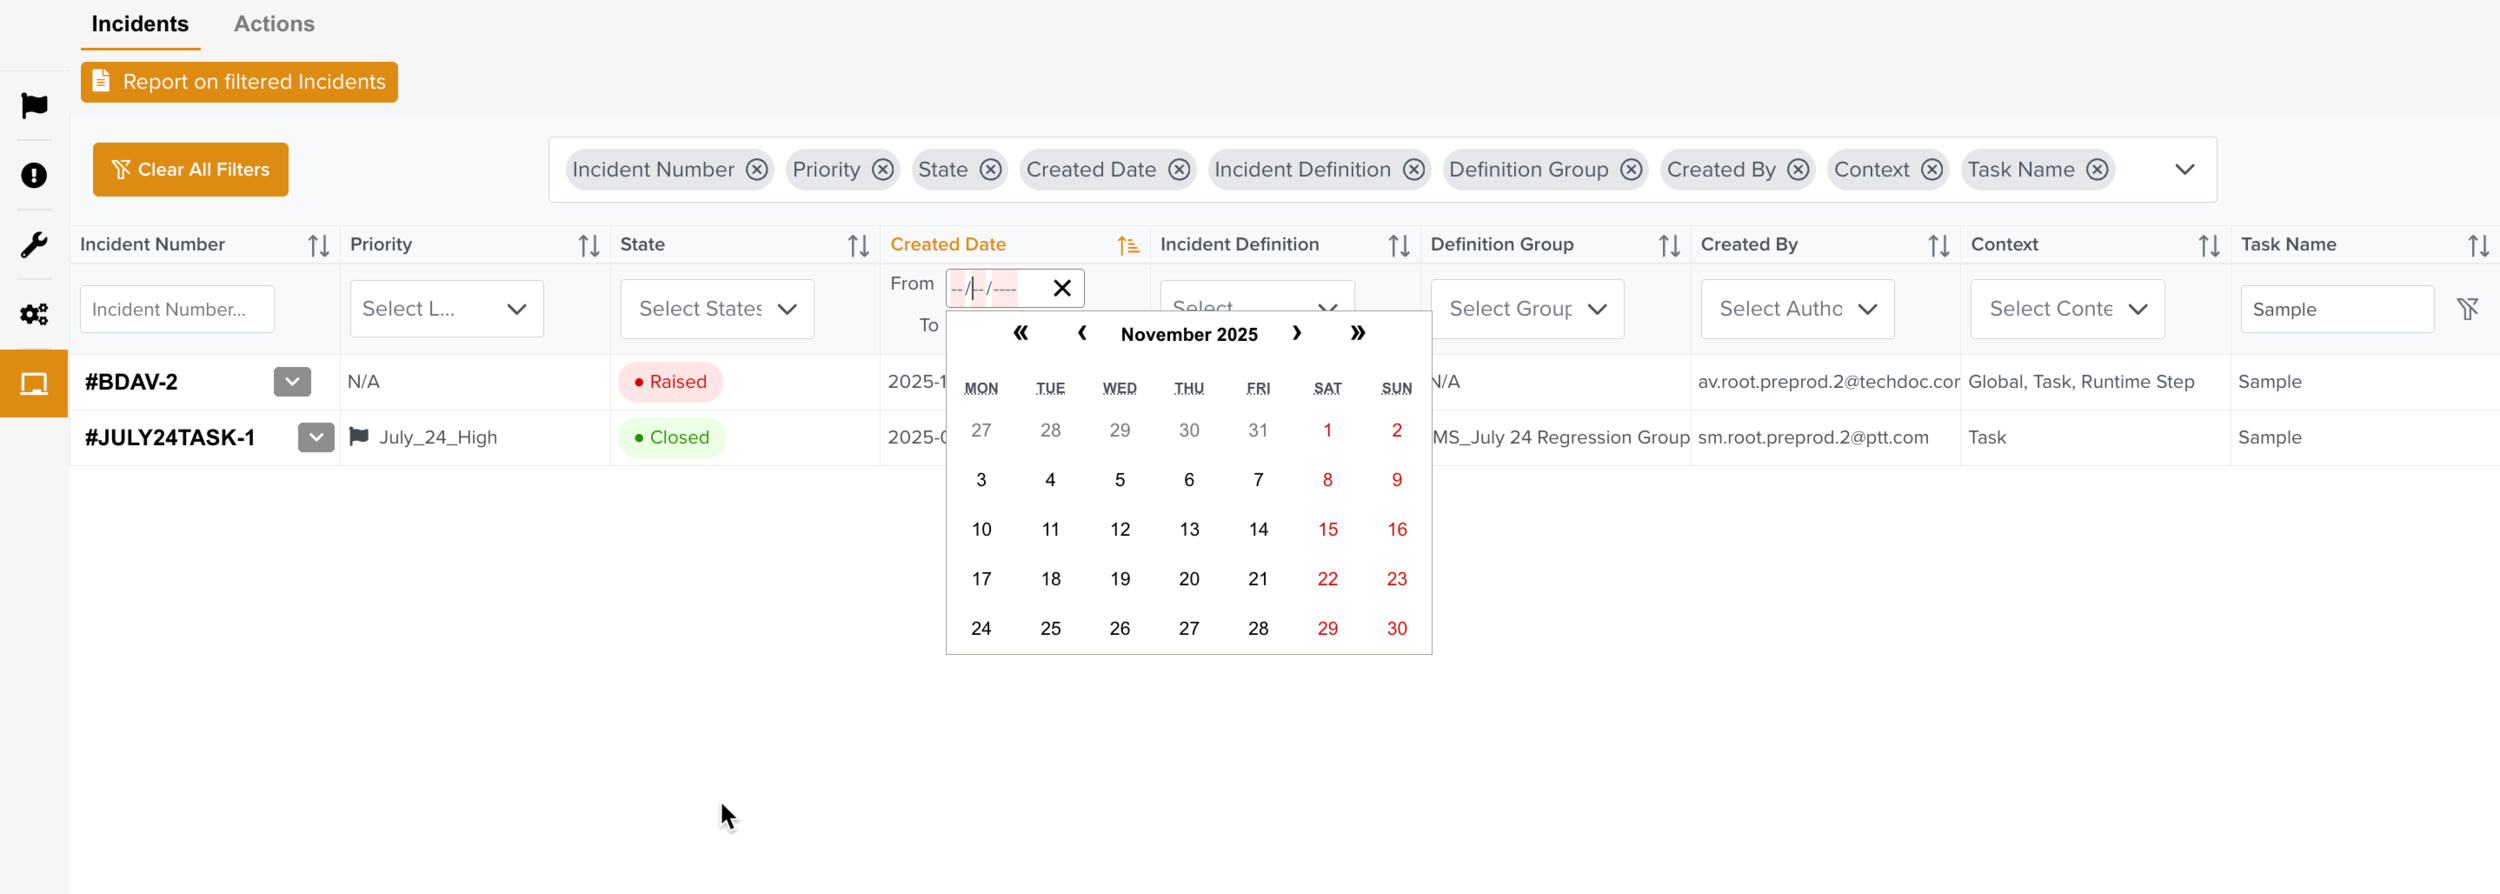
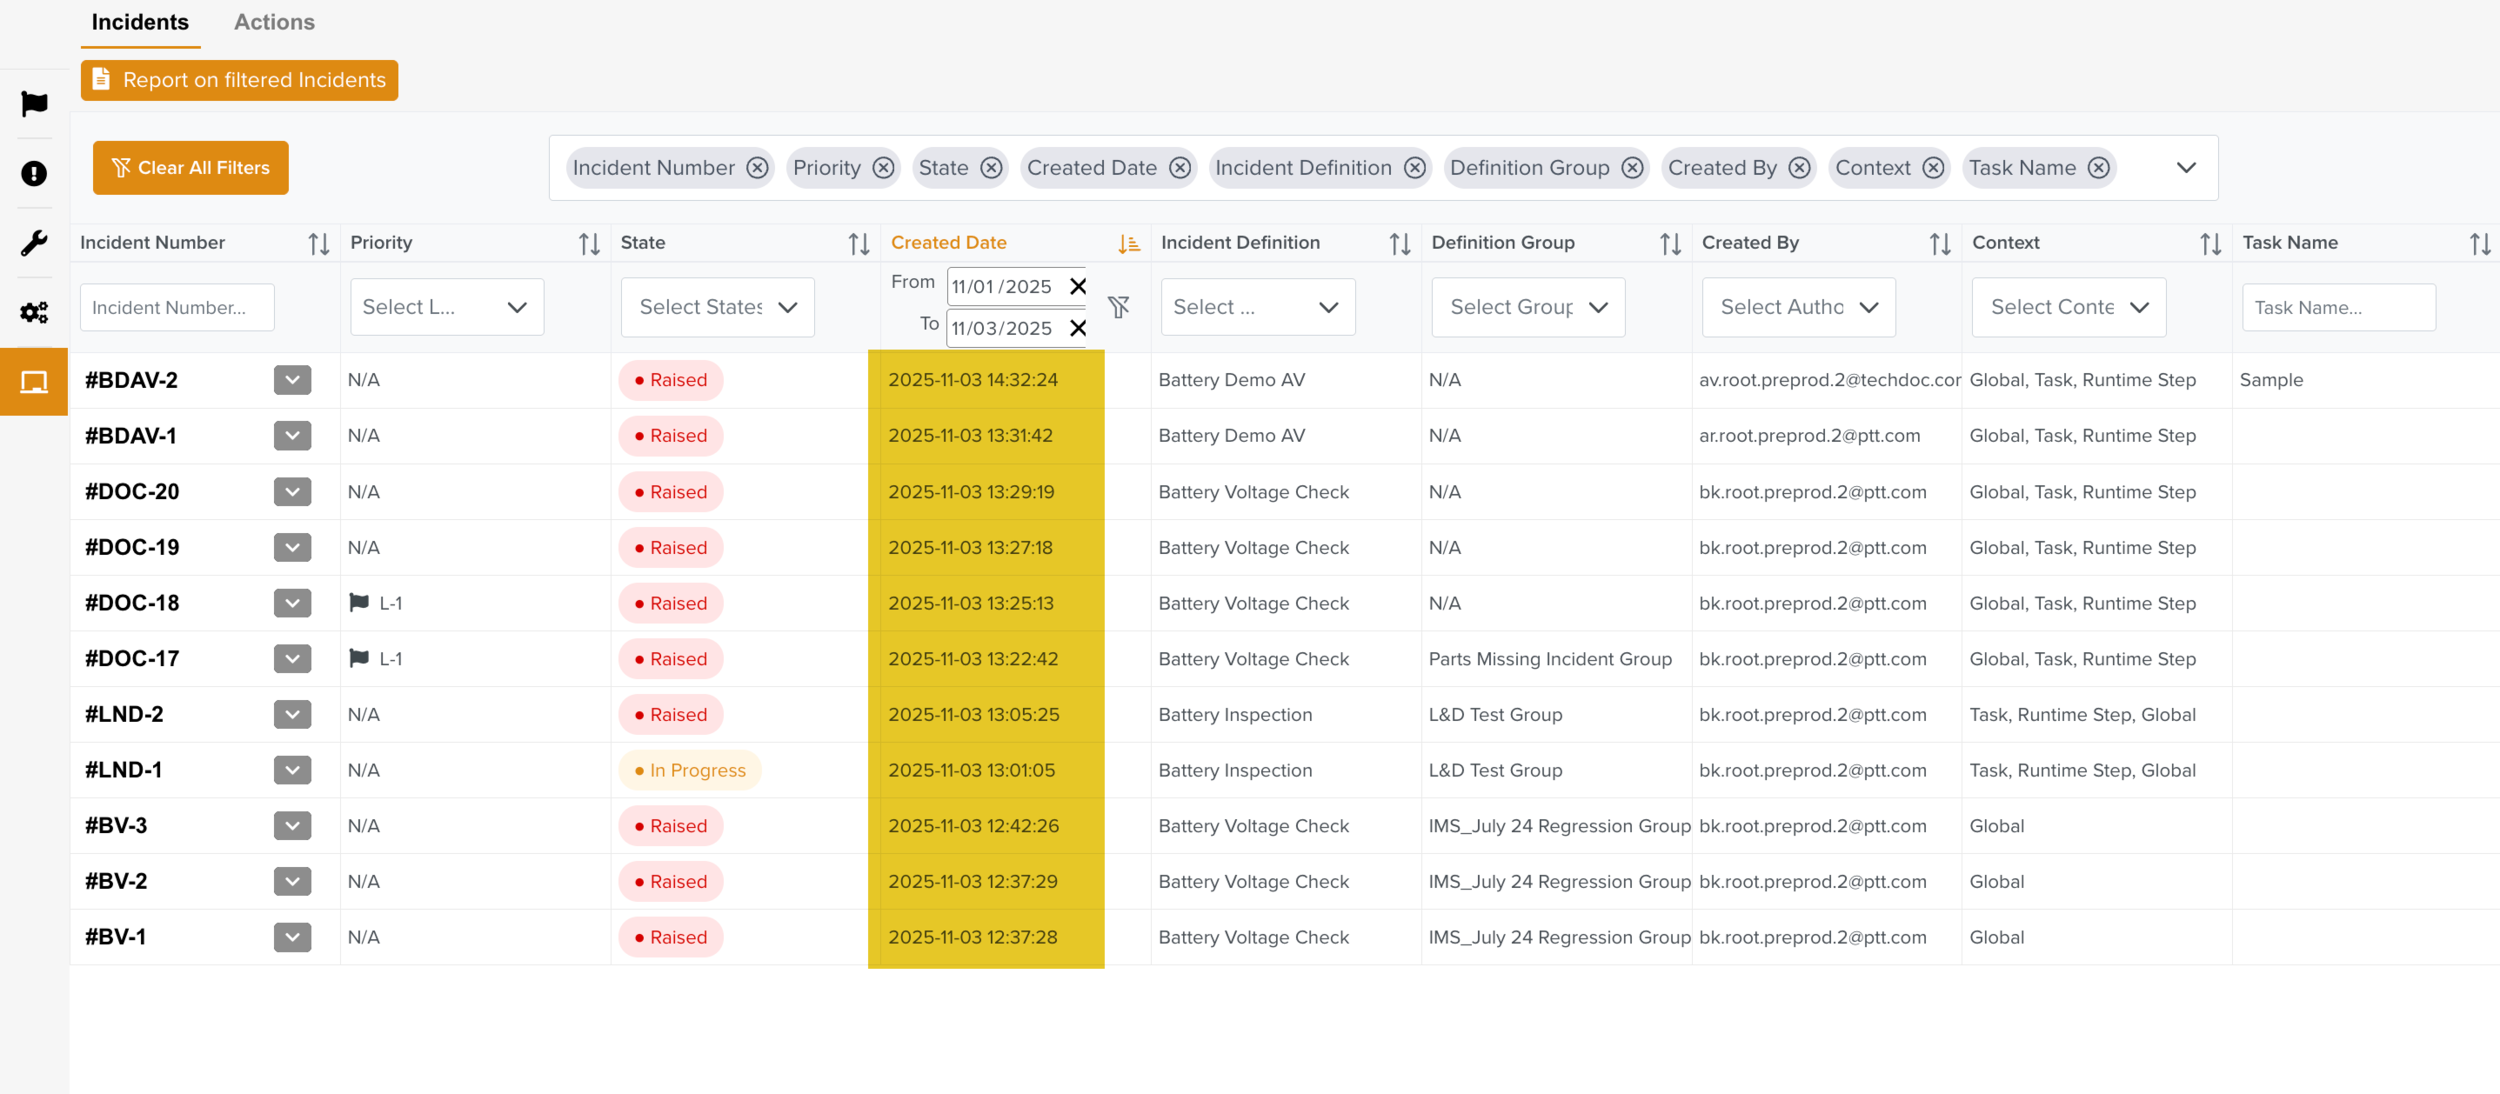
Created Date: In the below example, by selecting the From and To date, the Incidents created between the selected dates are filtered.
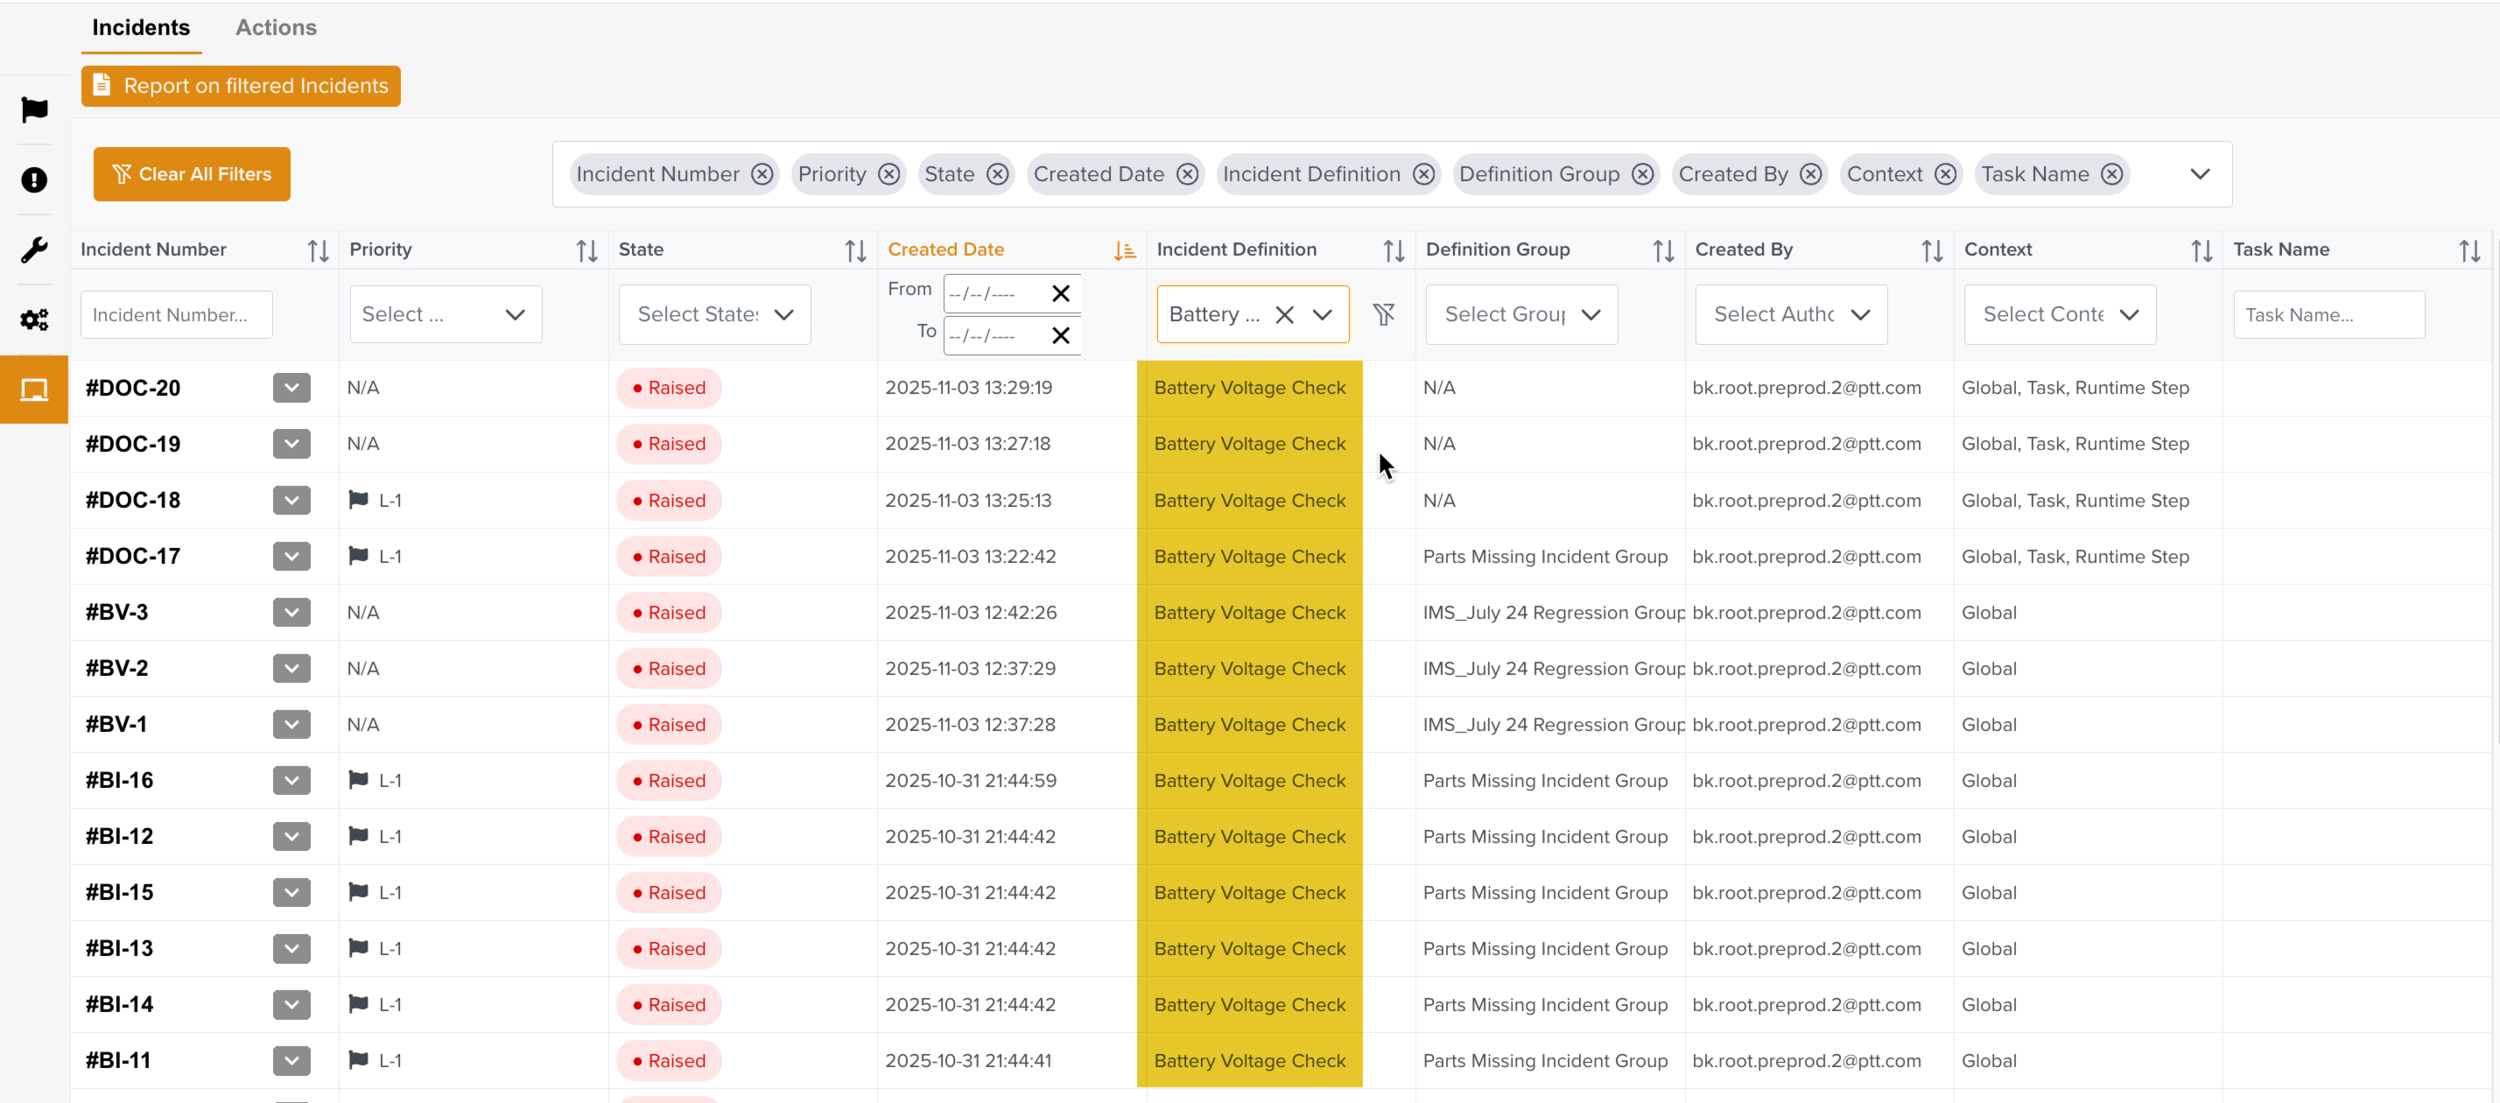
Incident Definition: In the below example, all the Incidents with the Incident Definition Battery Voltage Check are filtered.
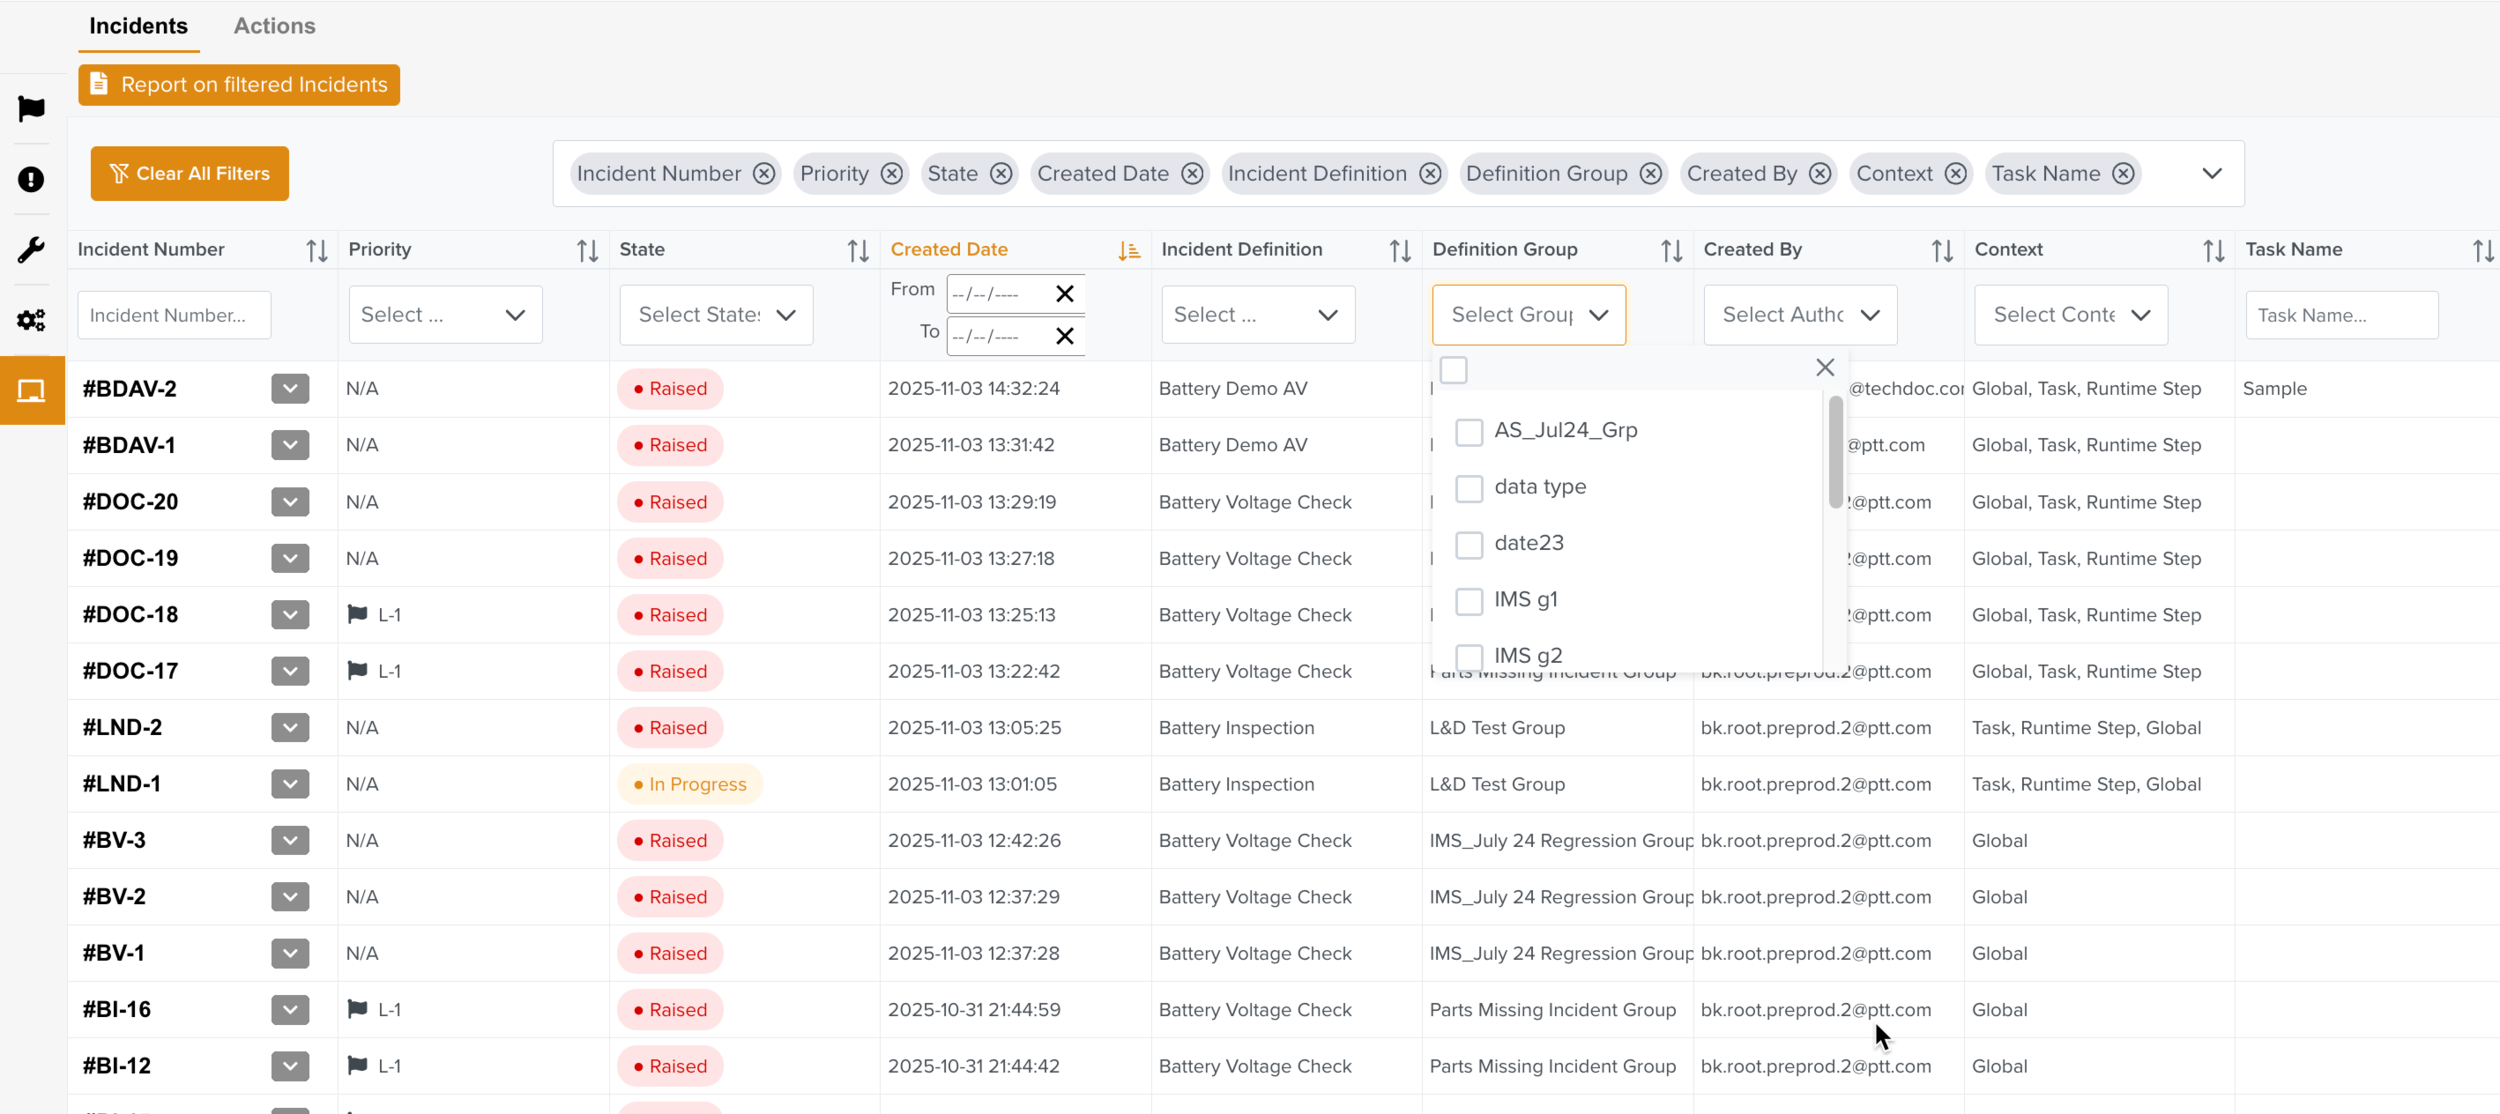
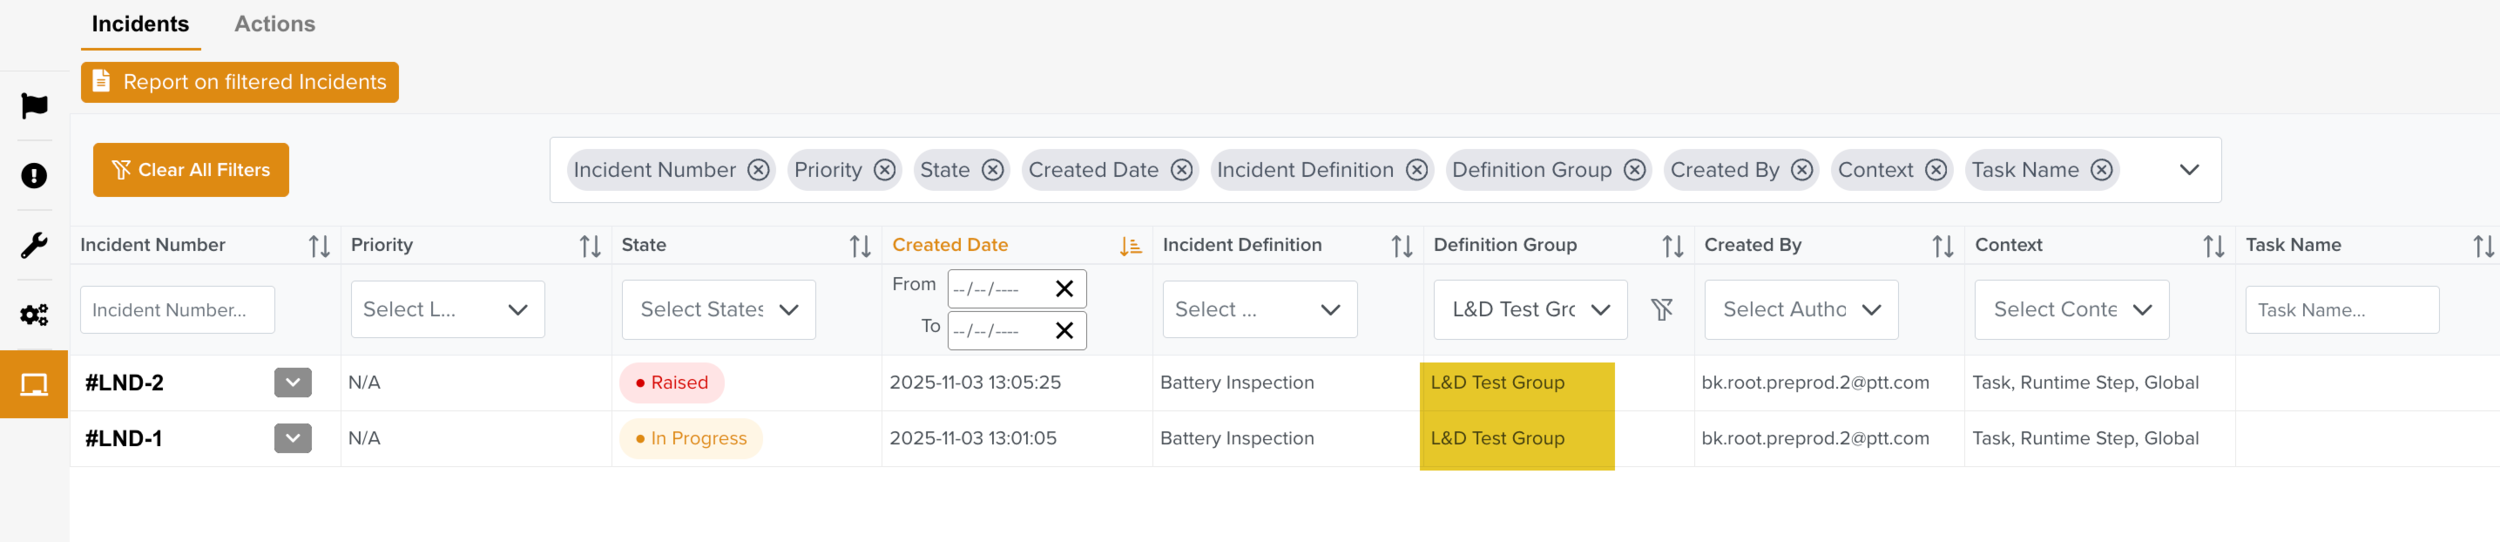
Definition Group: In the below example, all Incidents with Definition Group L&D Test Group are filtered.
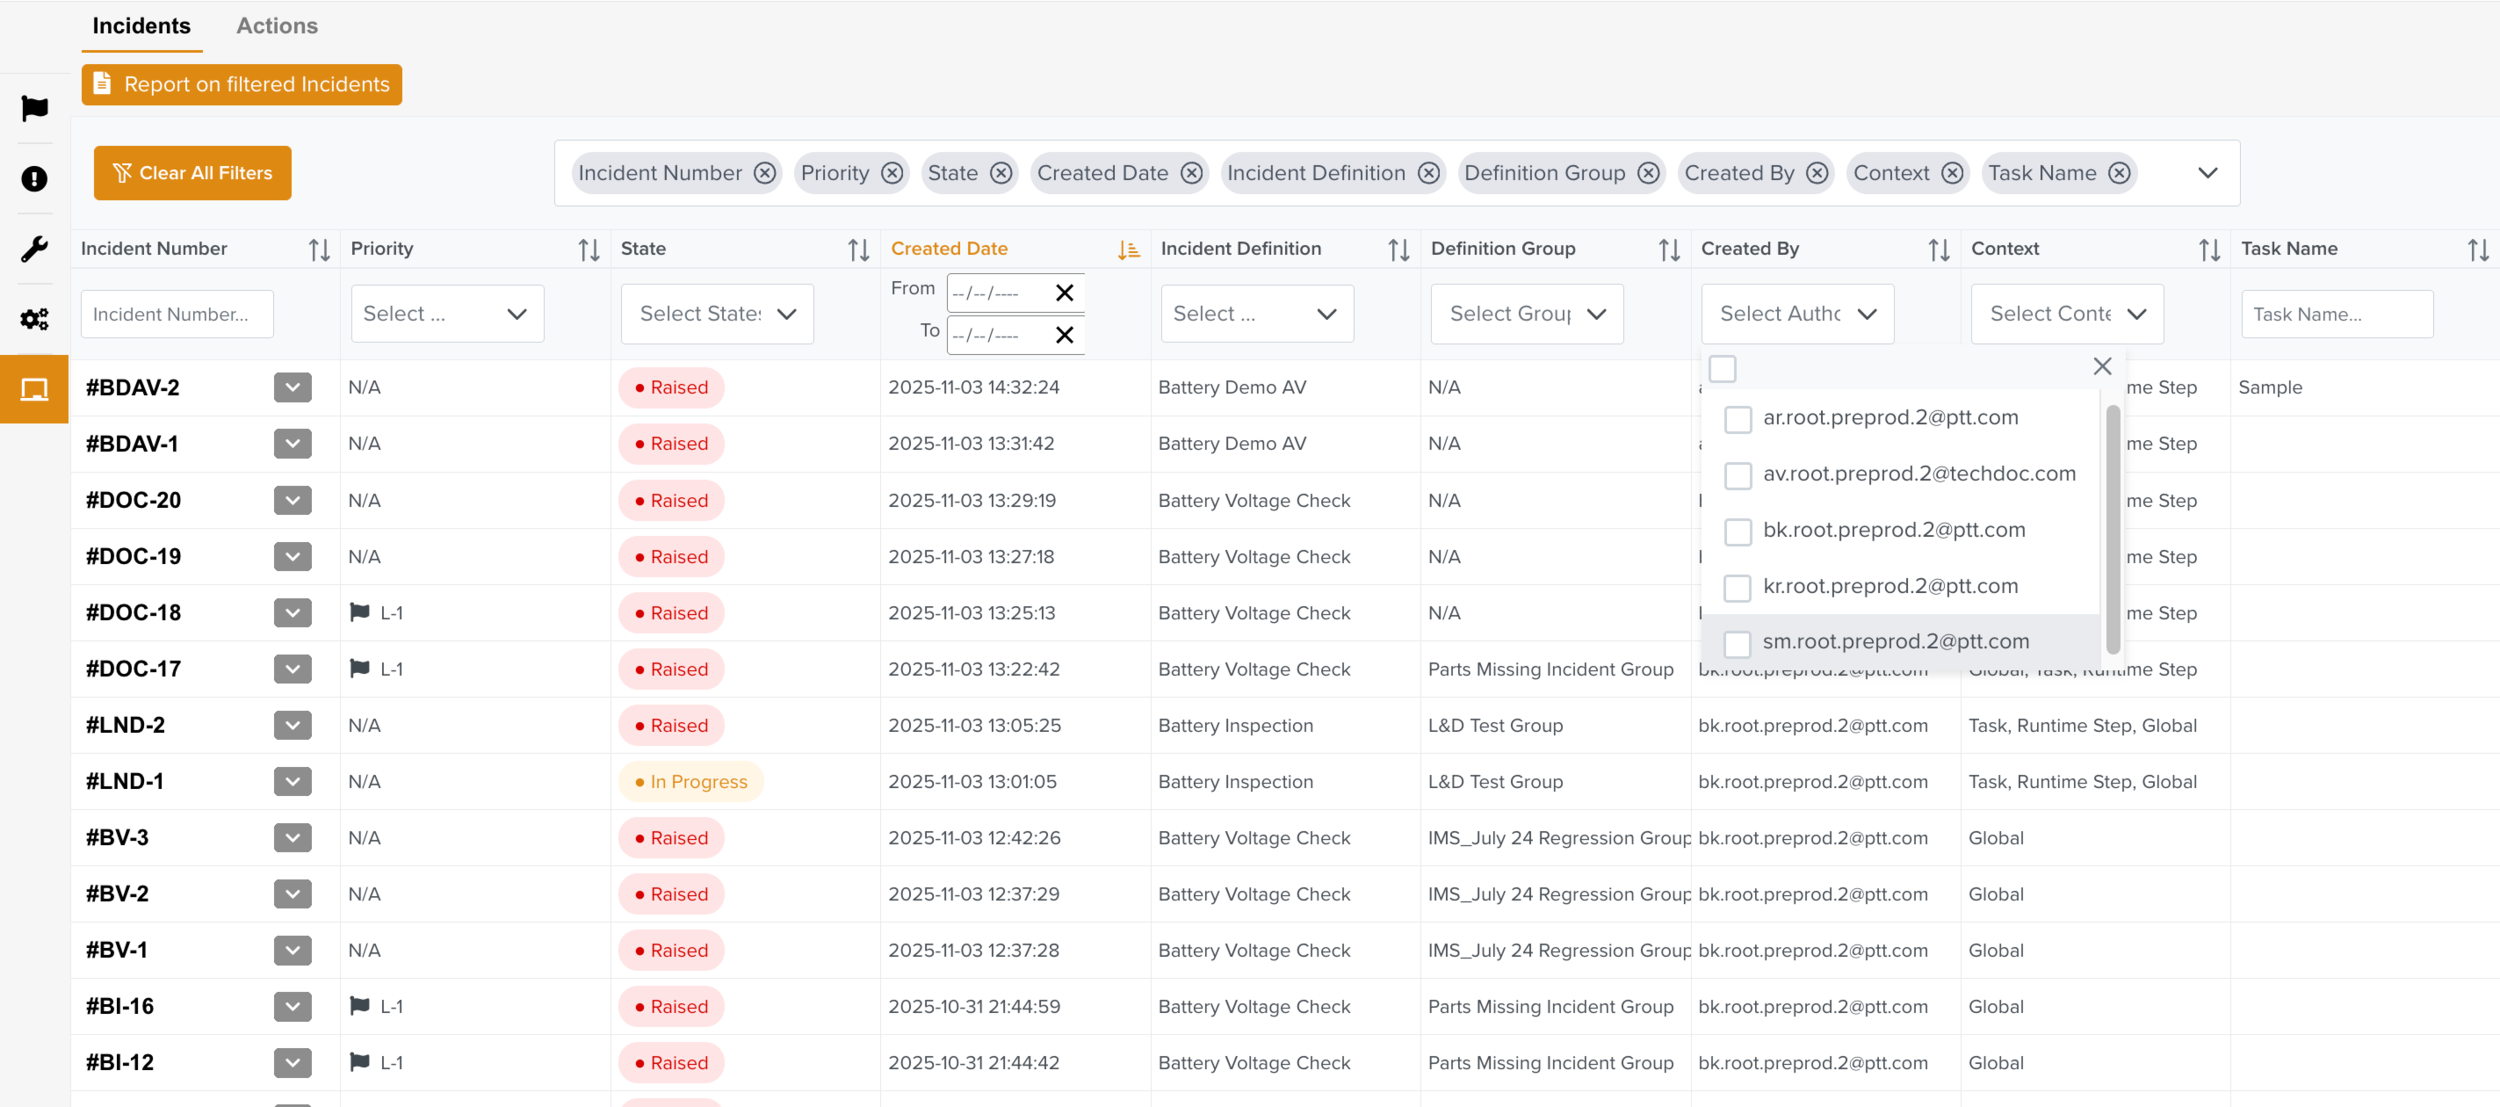
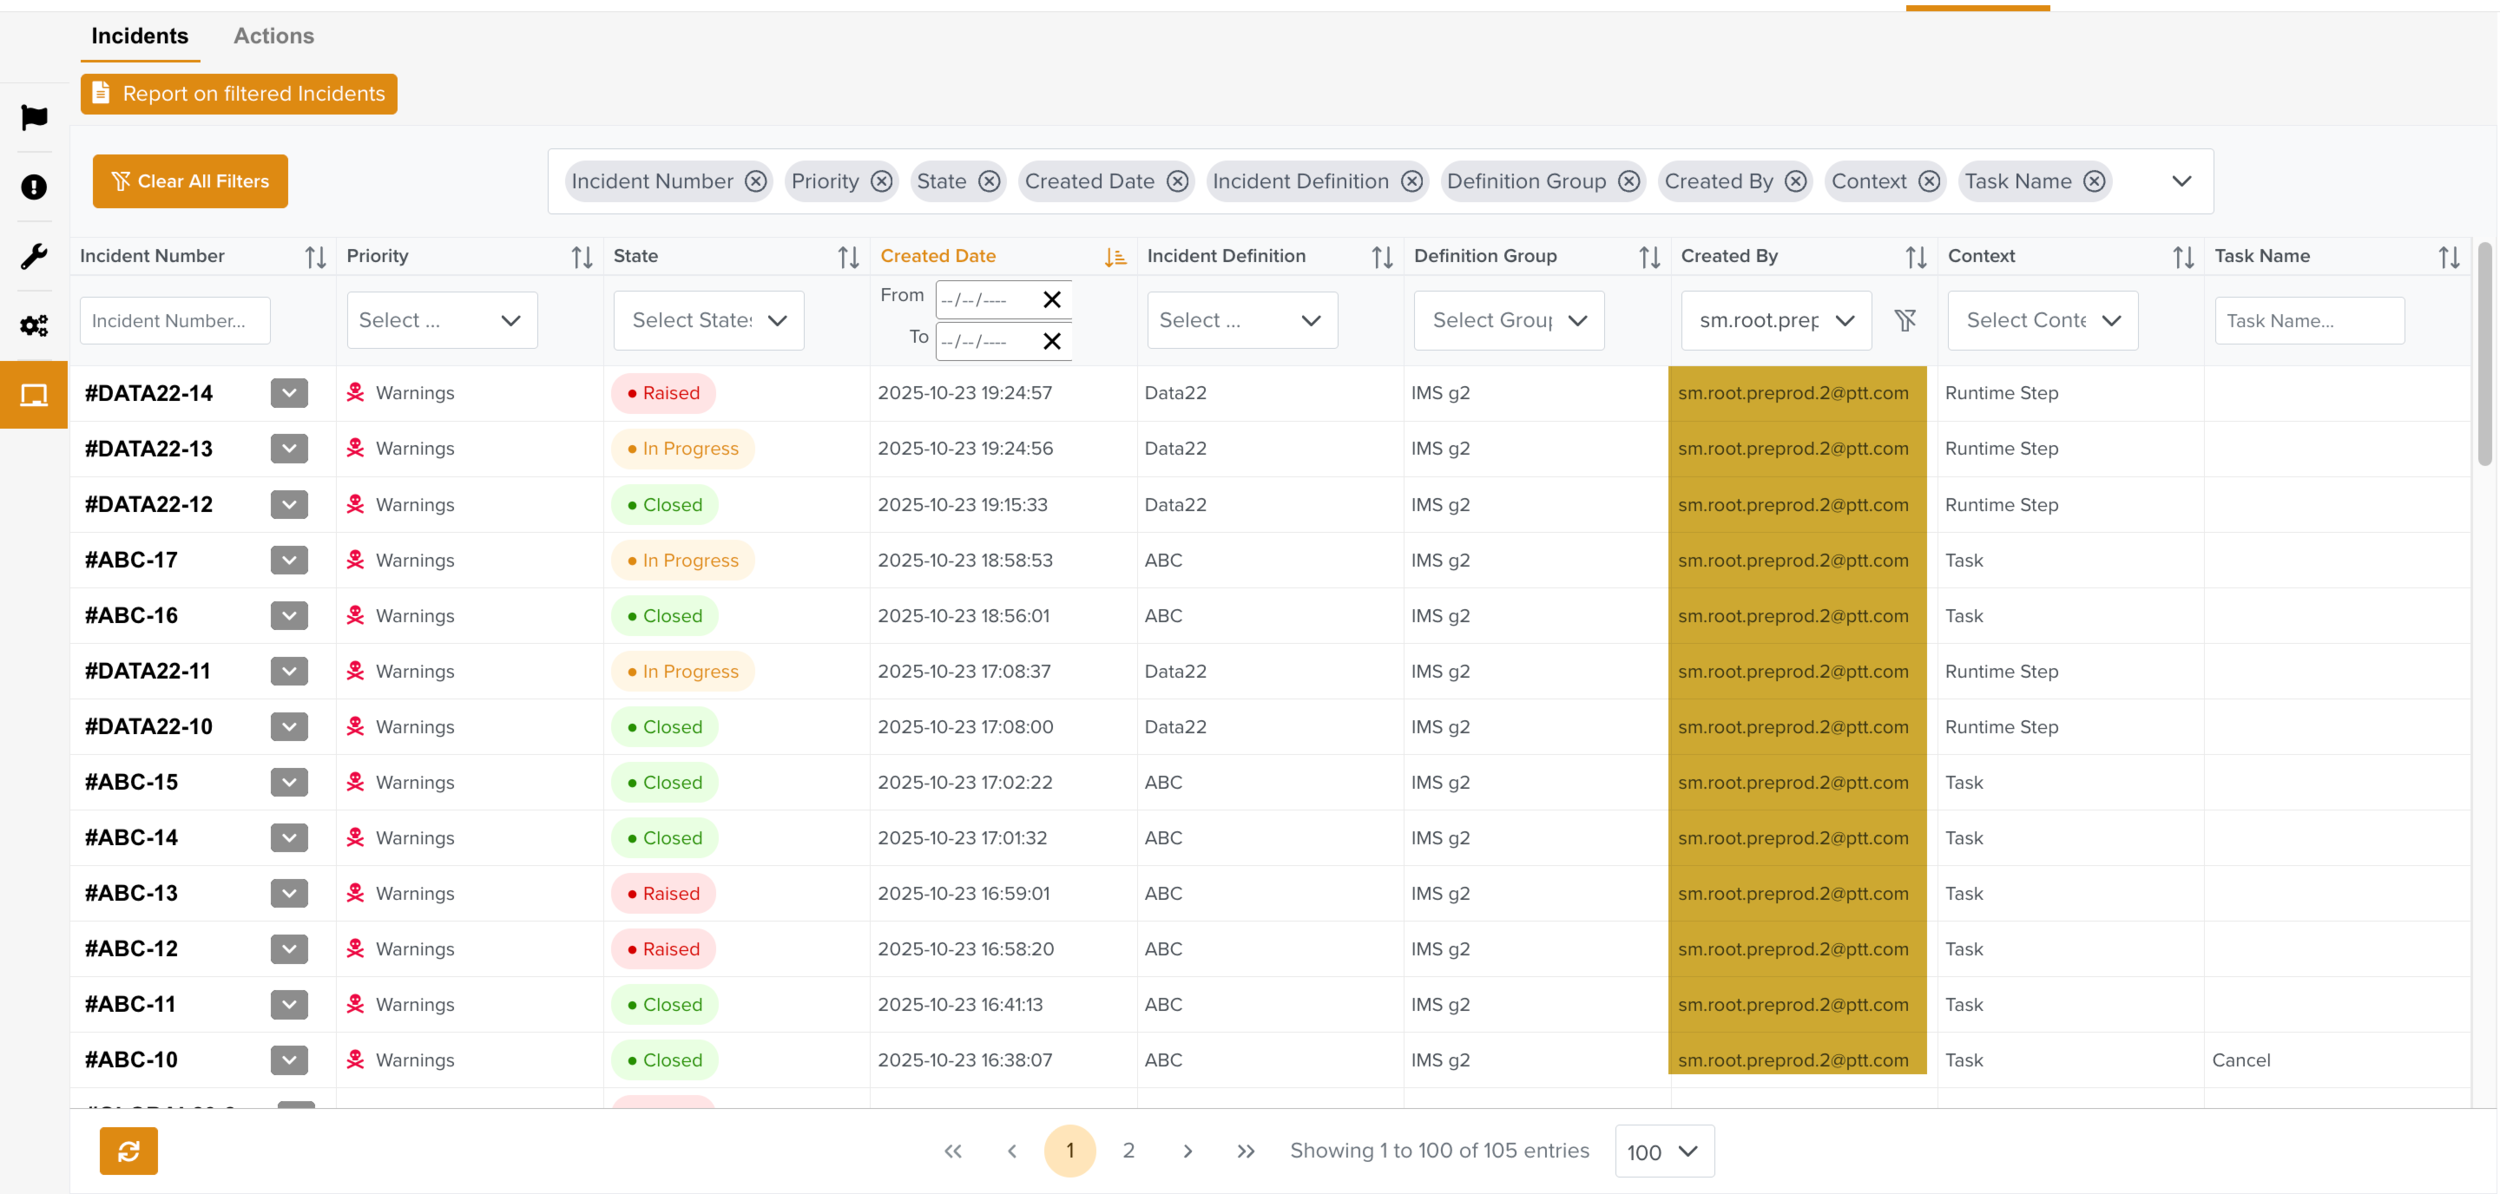
Created By: In the below example, the user sm.root.preprod.2@ppt.com is filtered.
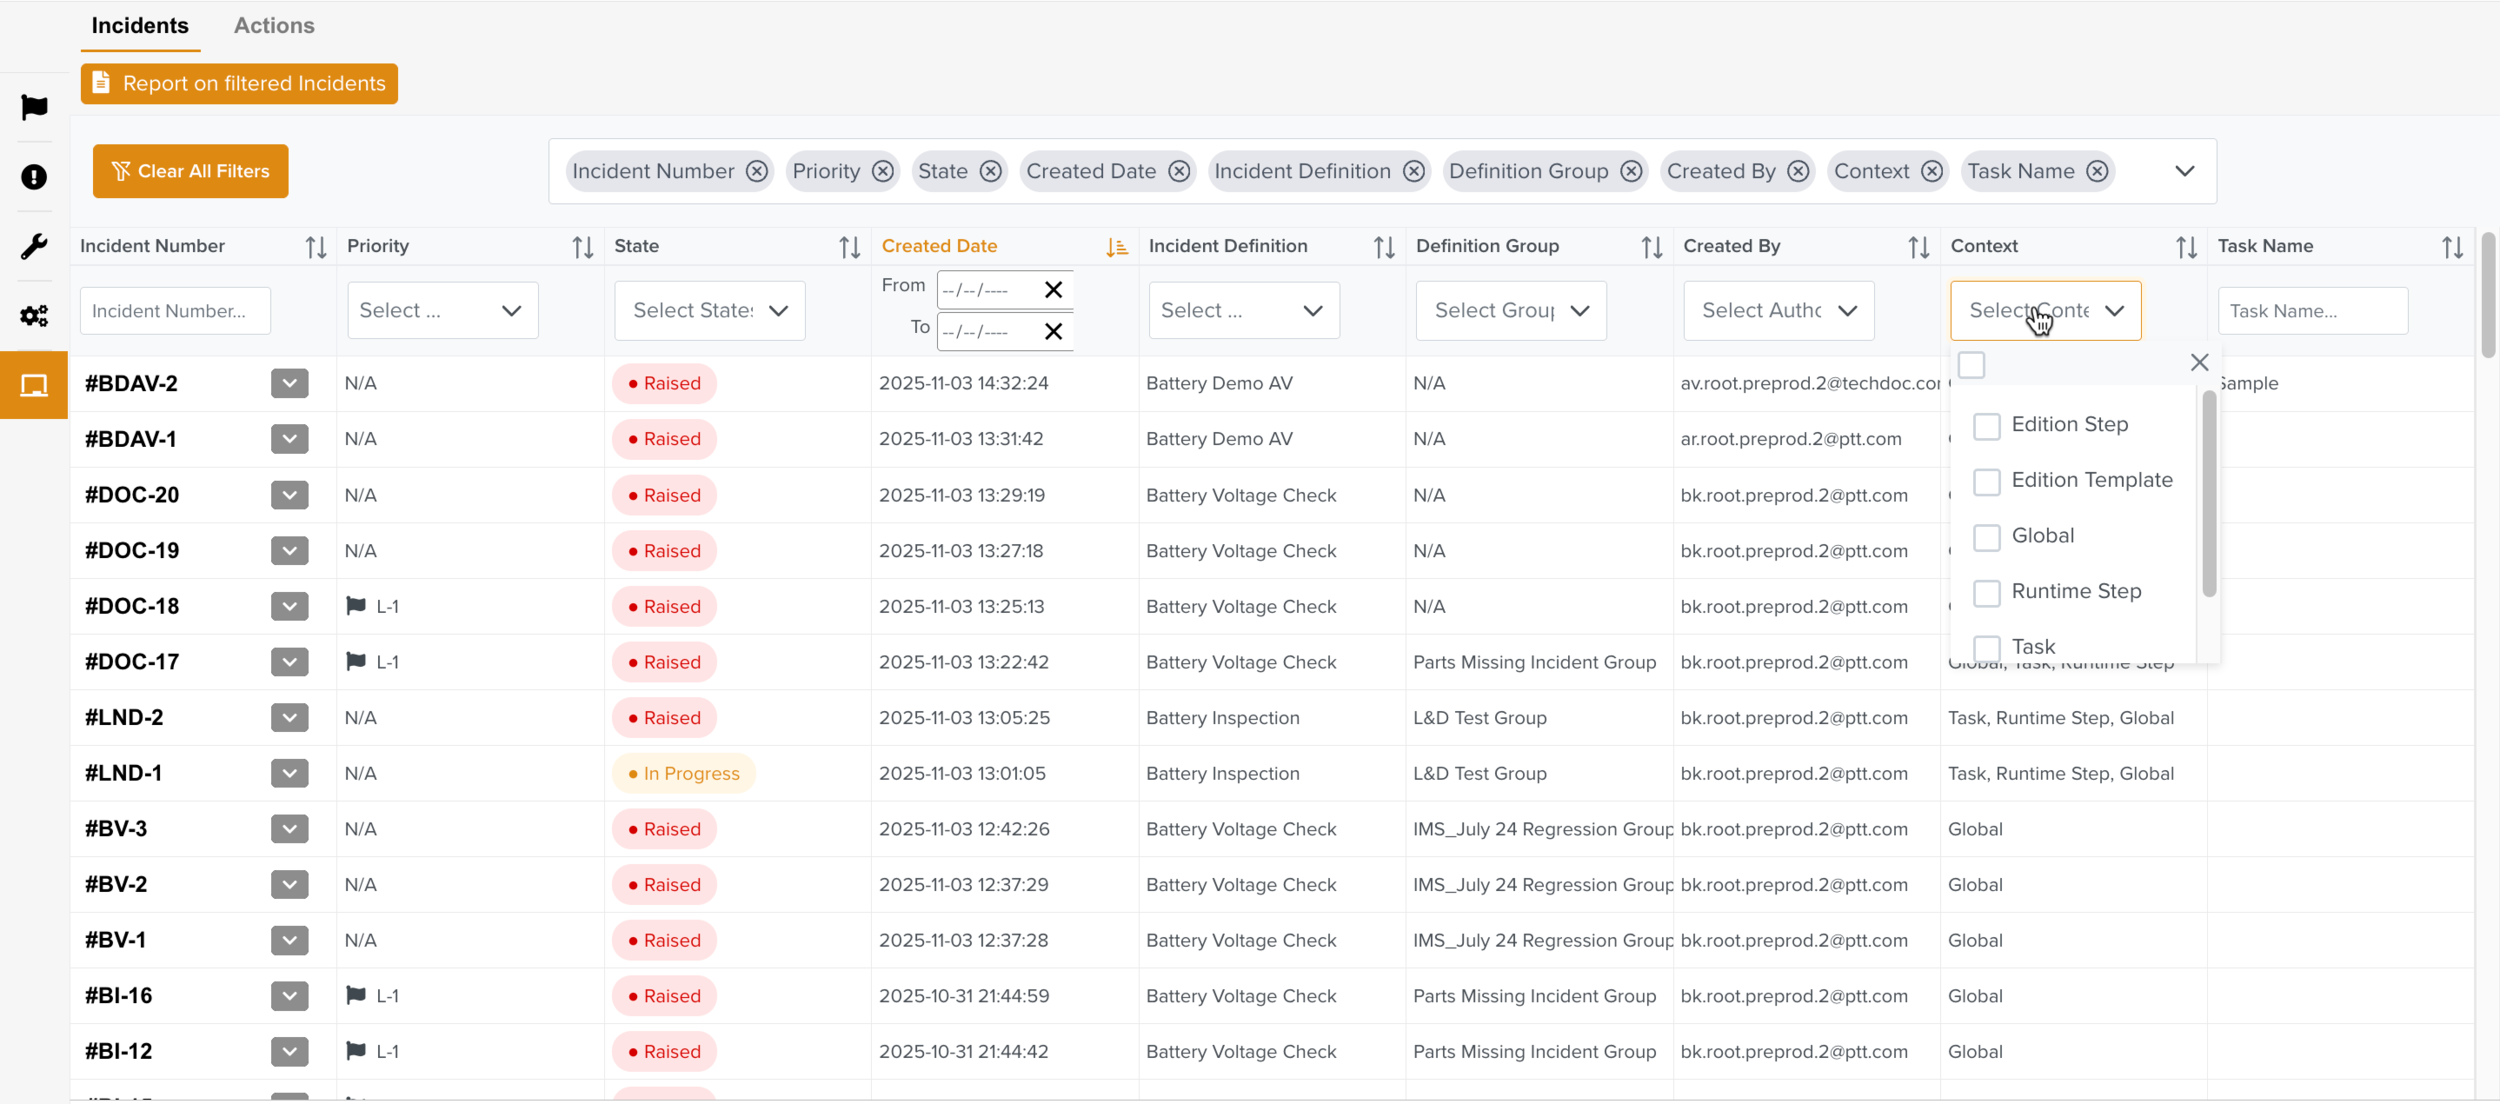
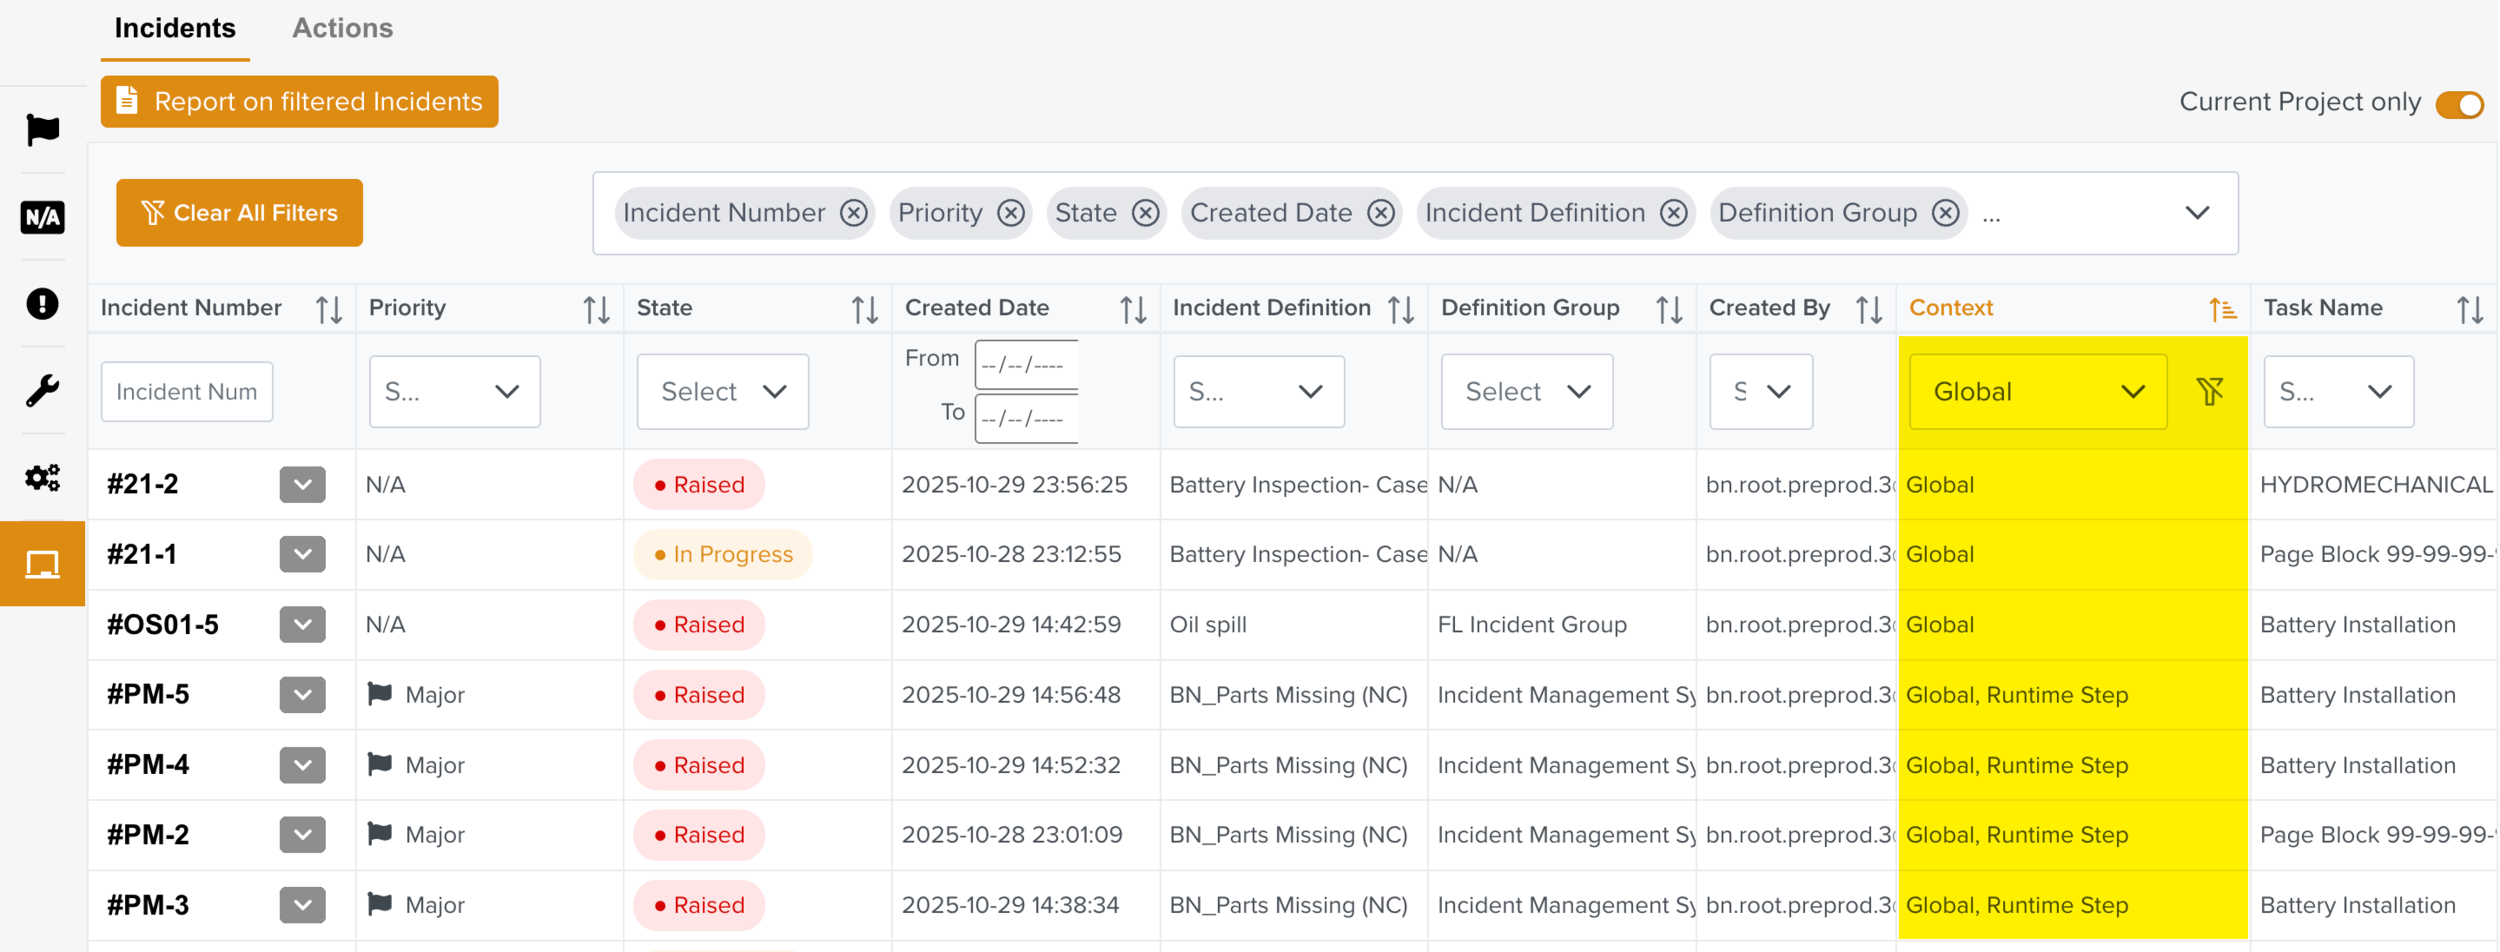
Context: In the below example, Global Context is filtered.
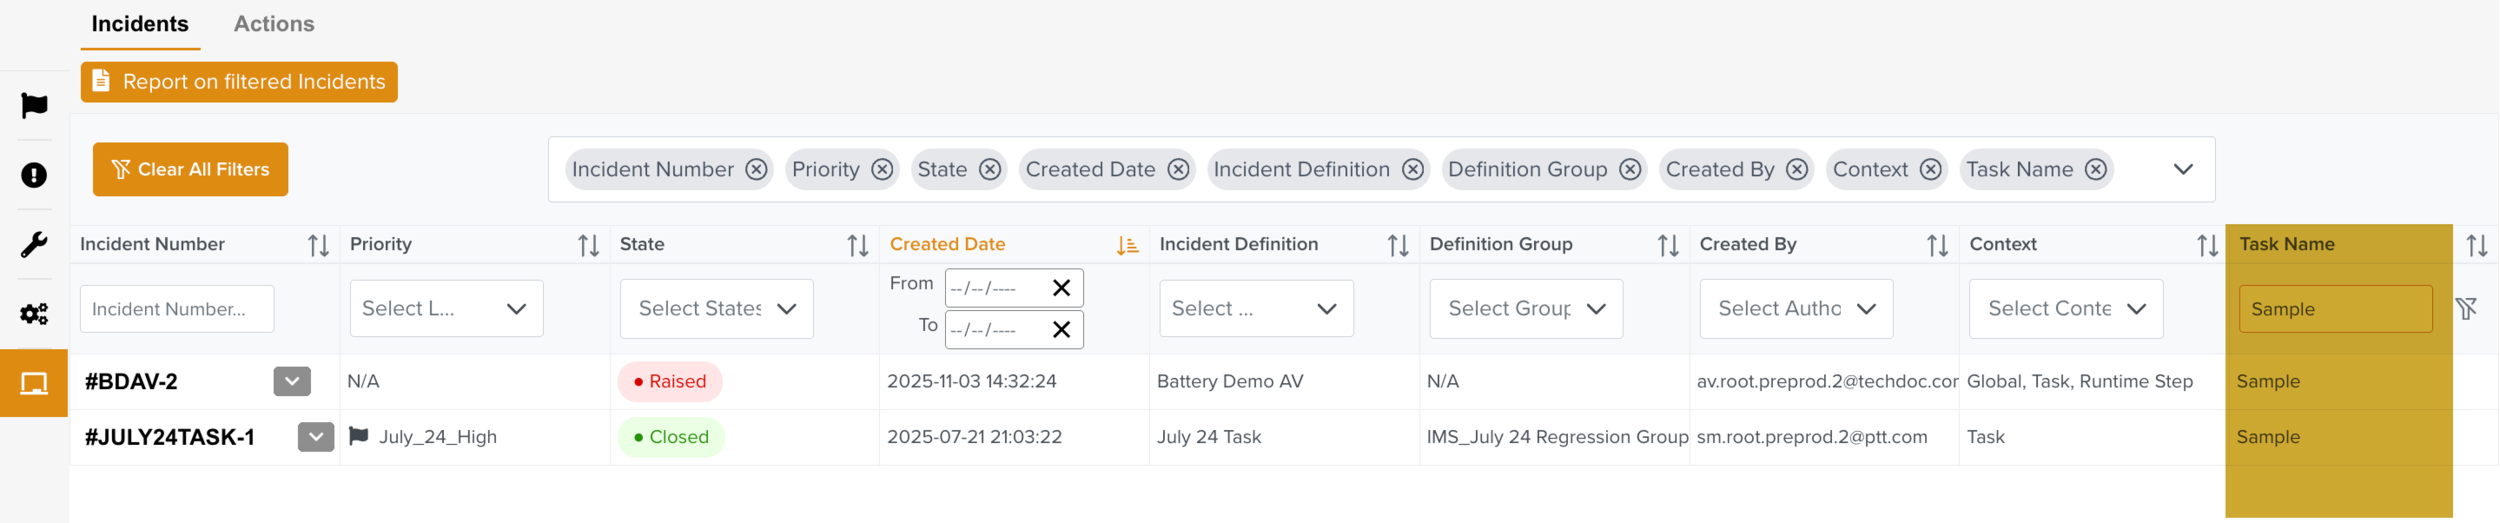
Task Name: Incidents can be filtered based on the Task from which the incident was raised.
In the example below, all Incidents raised from the Task Sample are filtered.
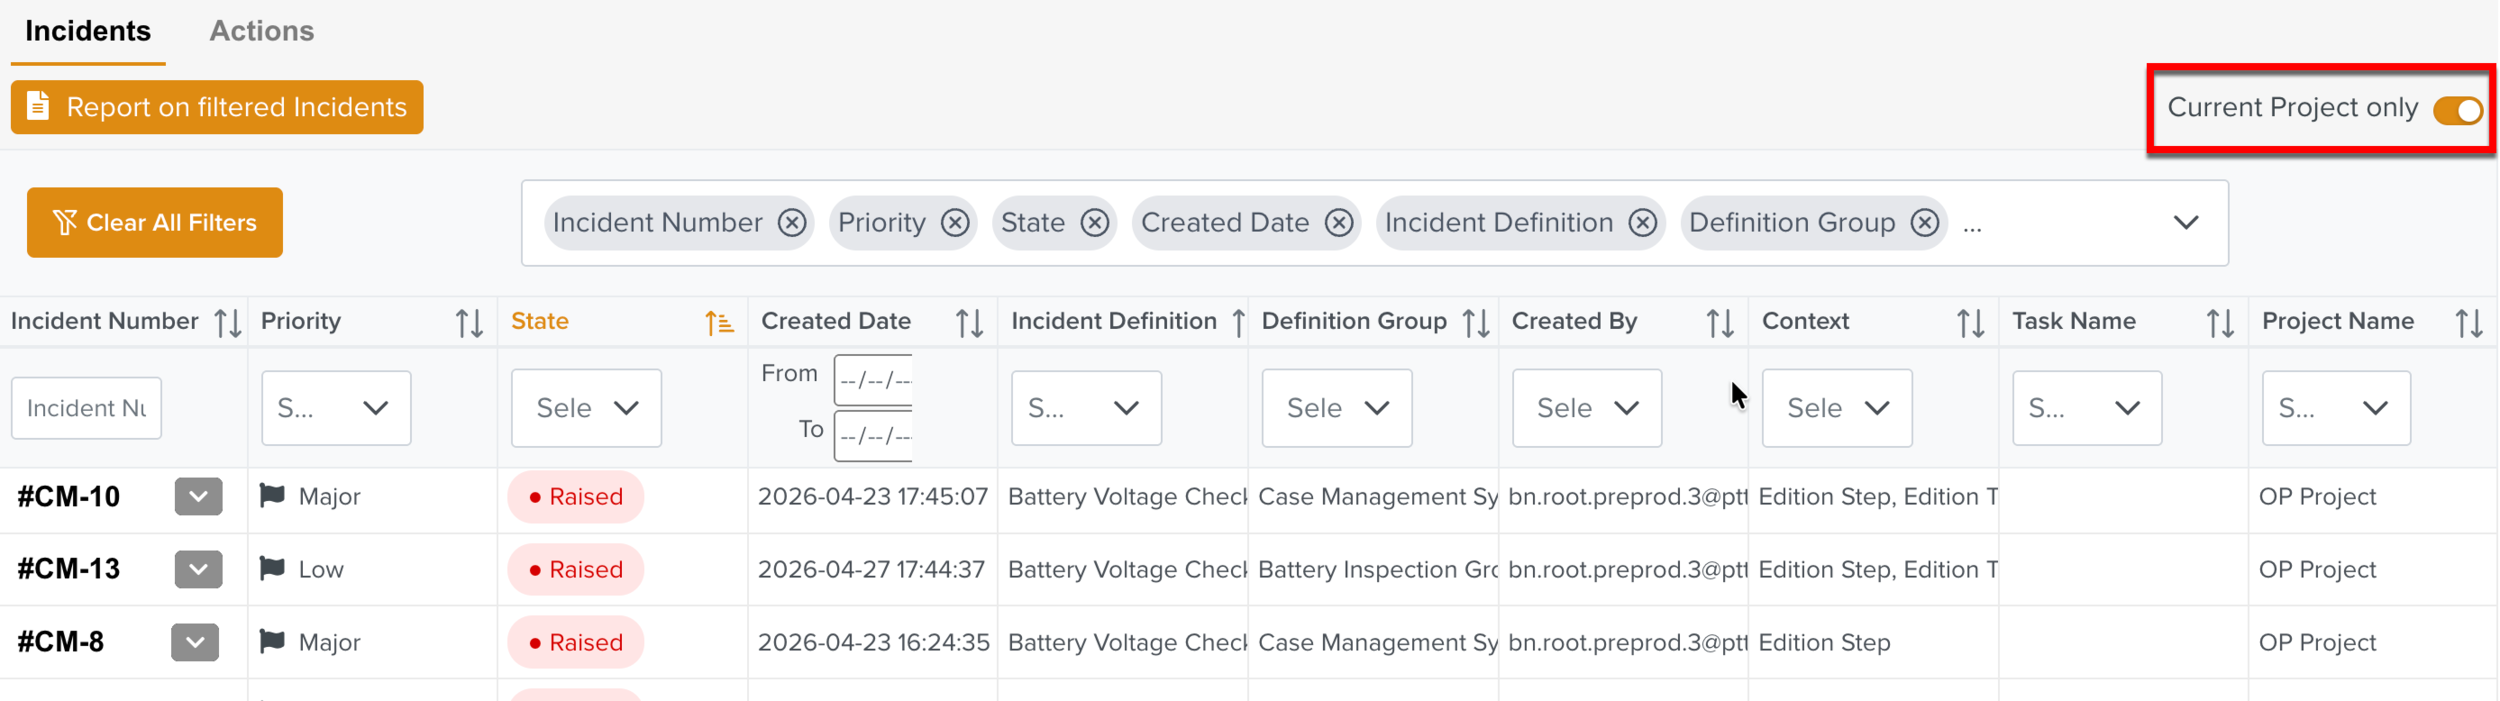
Project: Incidents can be filtered based on the Projects from which they are raised.
In the example below, all Incidents raised from the Project OP Project are filtered.
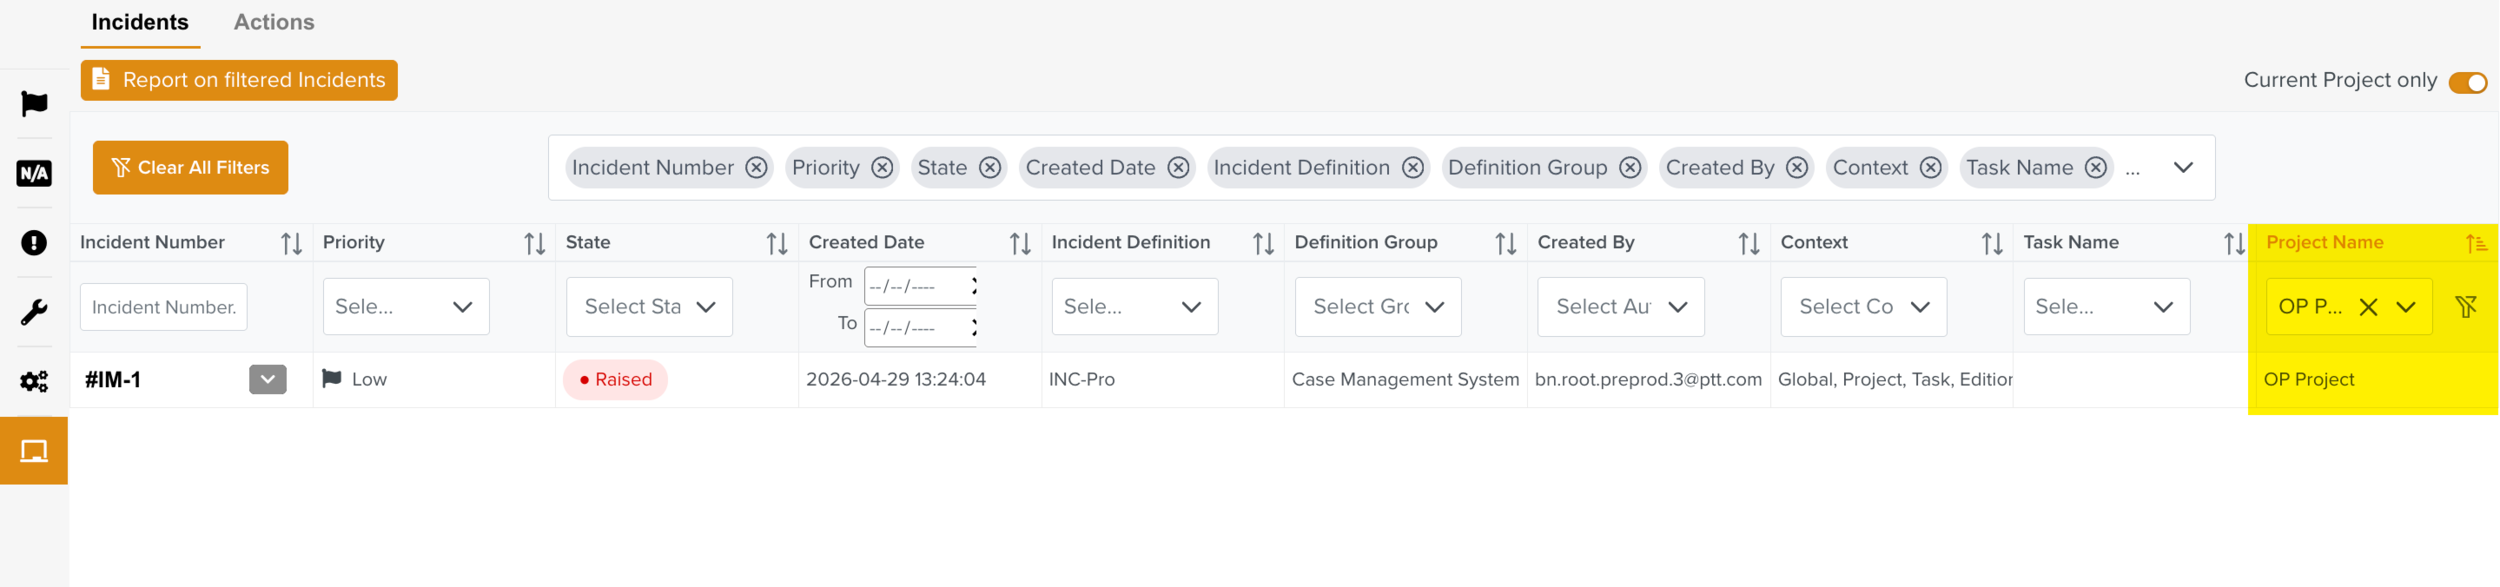
To view the Incidents raised from the current Project, enable the toggle Current Project only.
 |
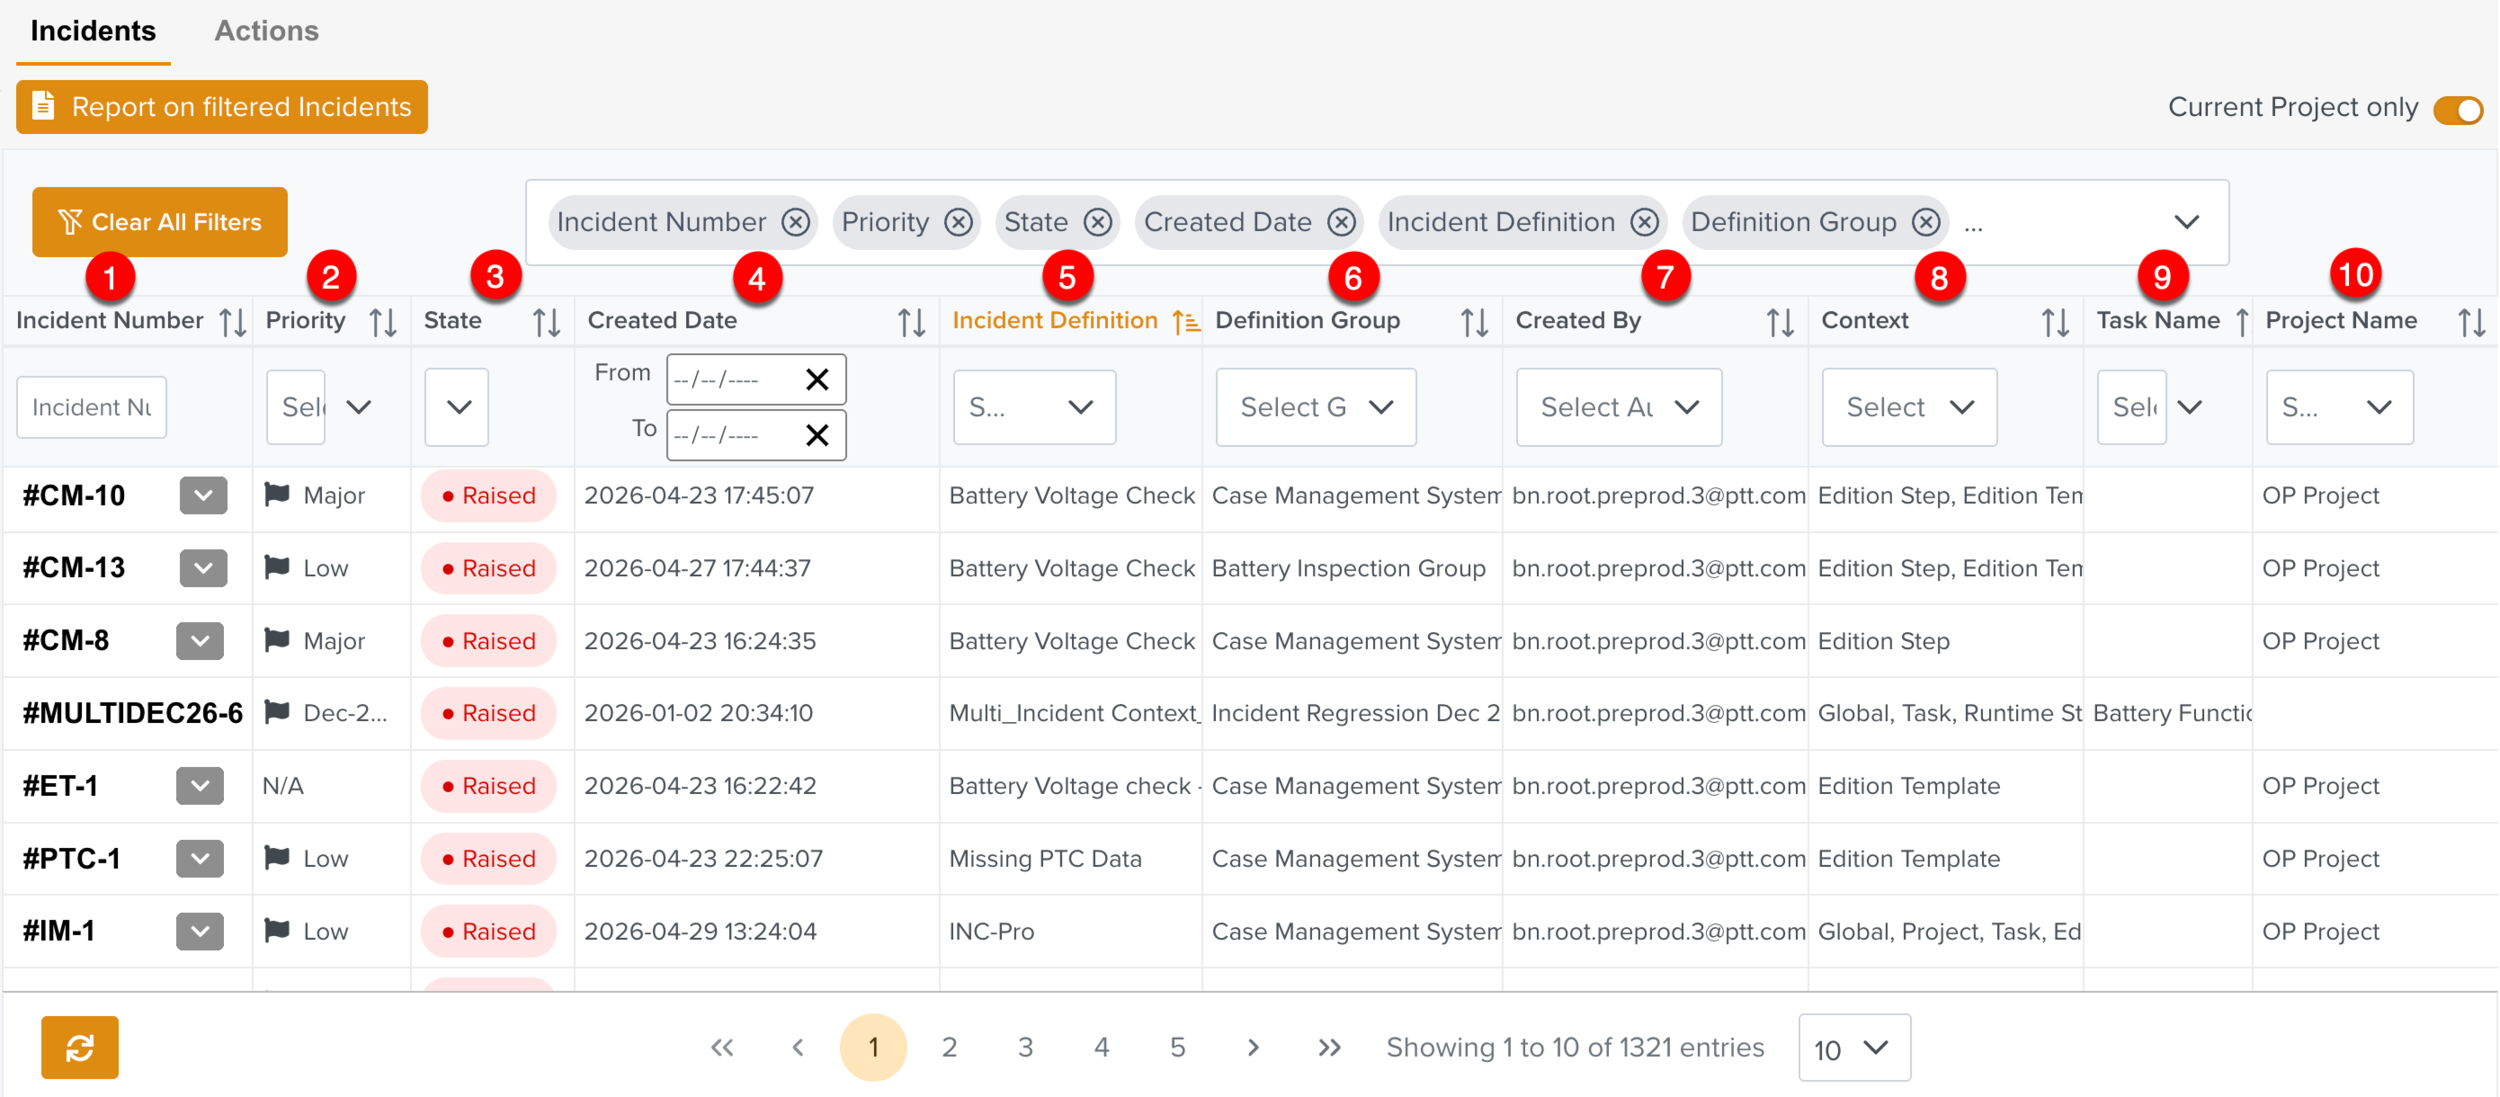
You can sort all the the 10 columns by using  icon.
icon.
You can clear all the applied filters applied by using Clear All filters as shown below.
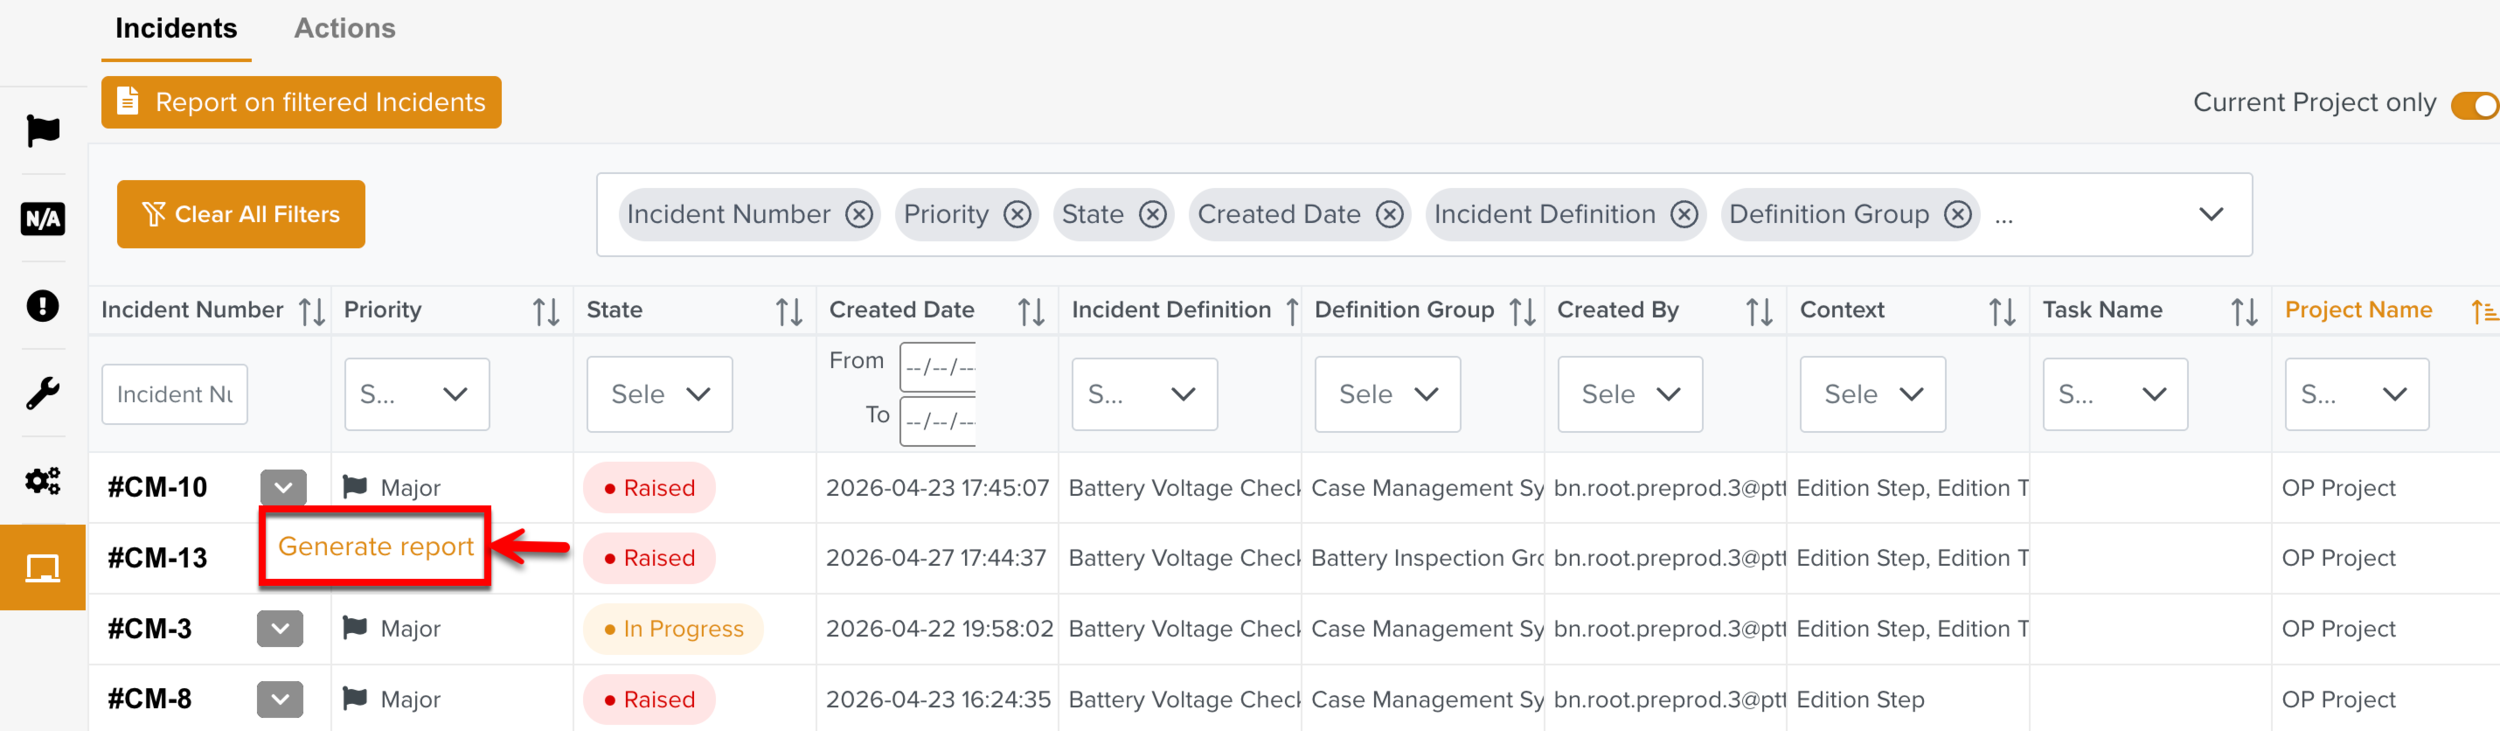
You can generate an Incident Report using the option on the raised Incident.
 |
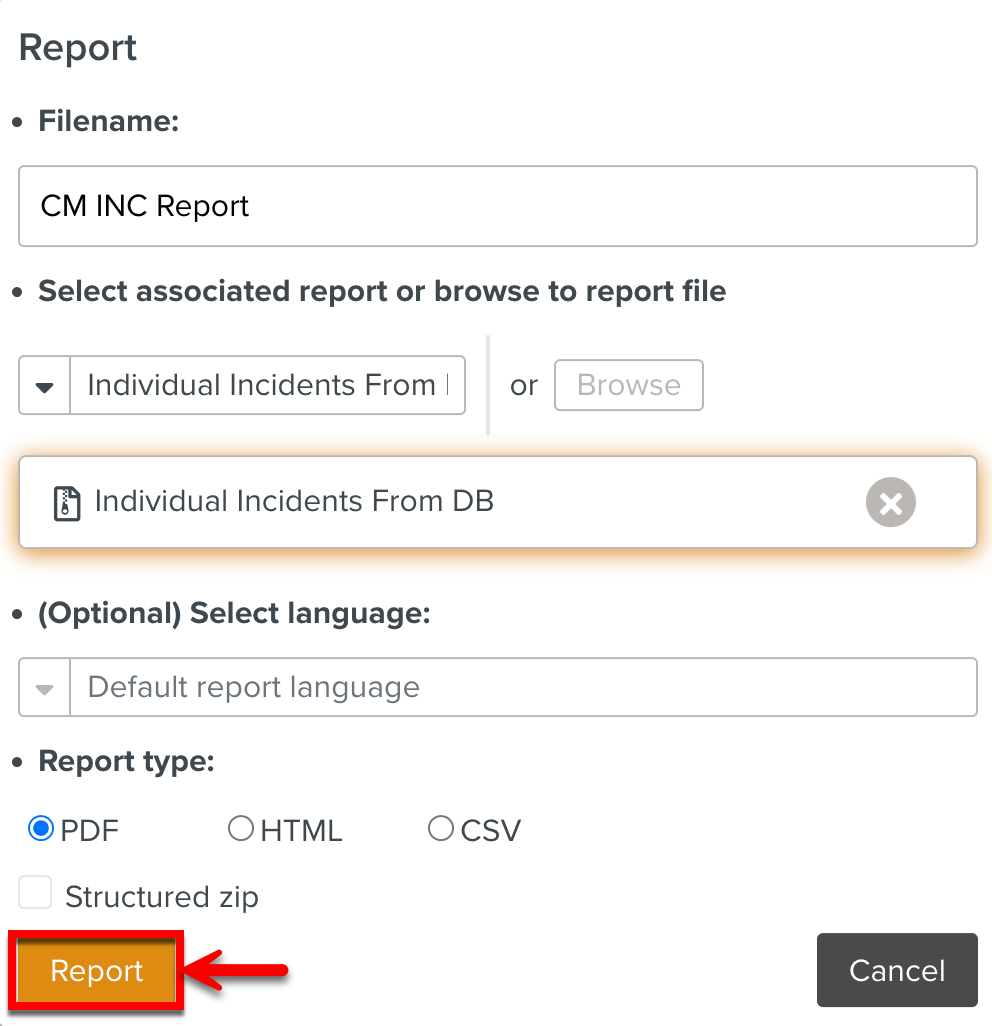 |
Note
Report Models are created and associated to the respective Report Packages to be used for Incident Report generation.
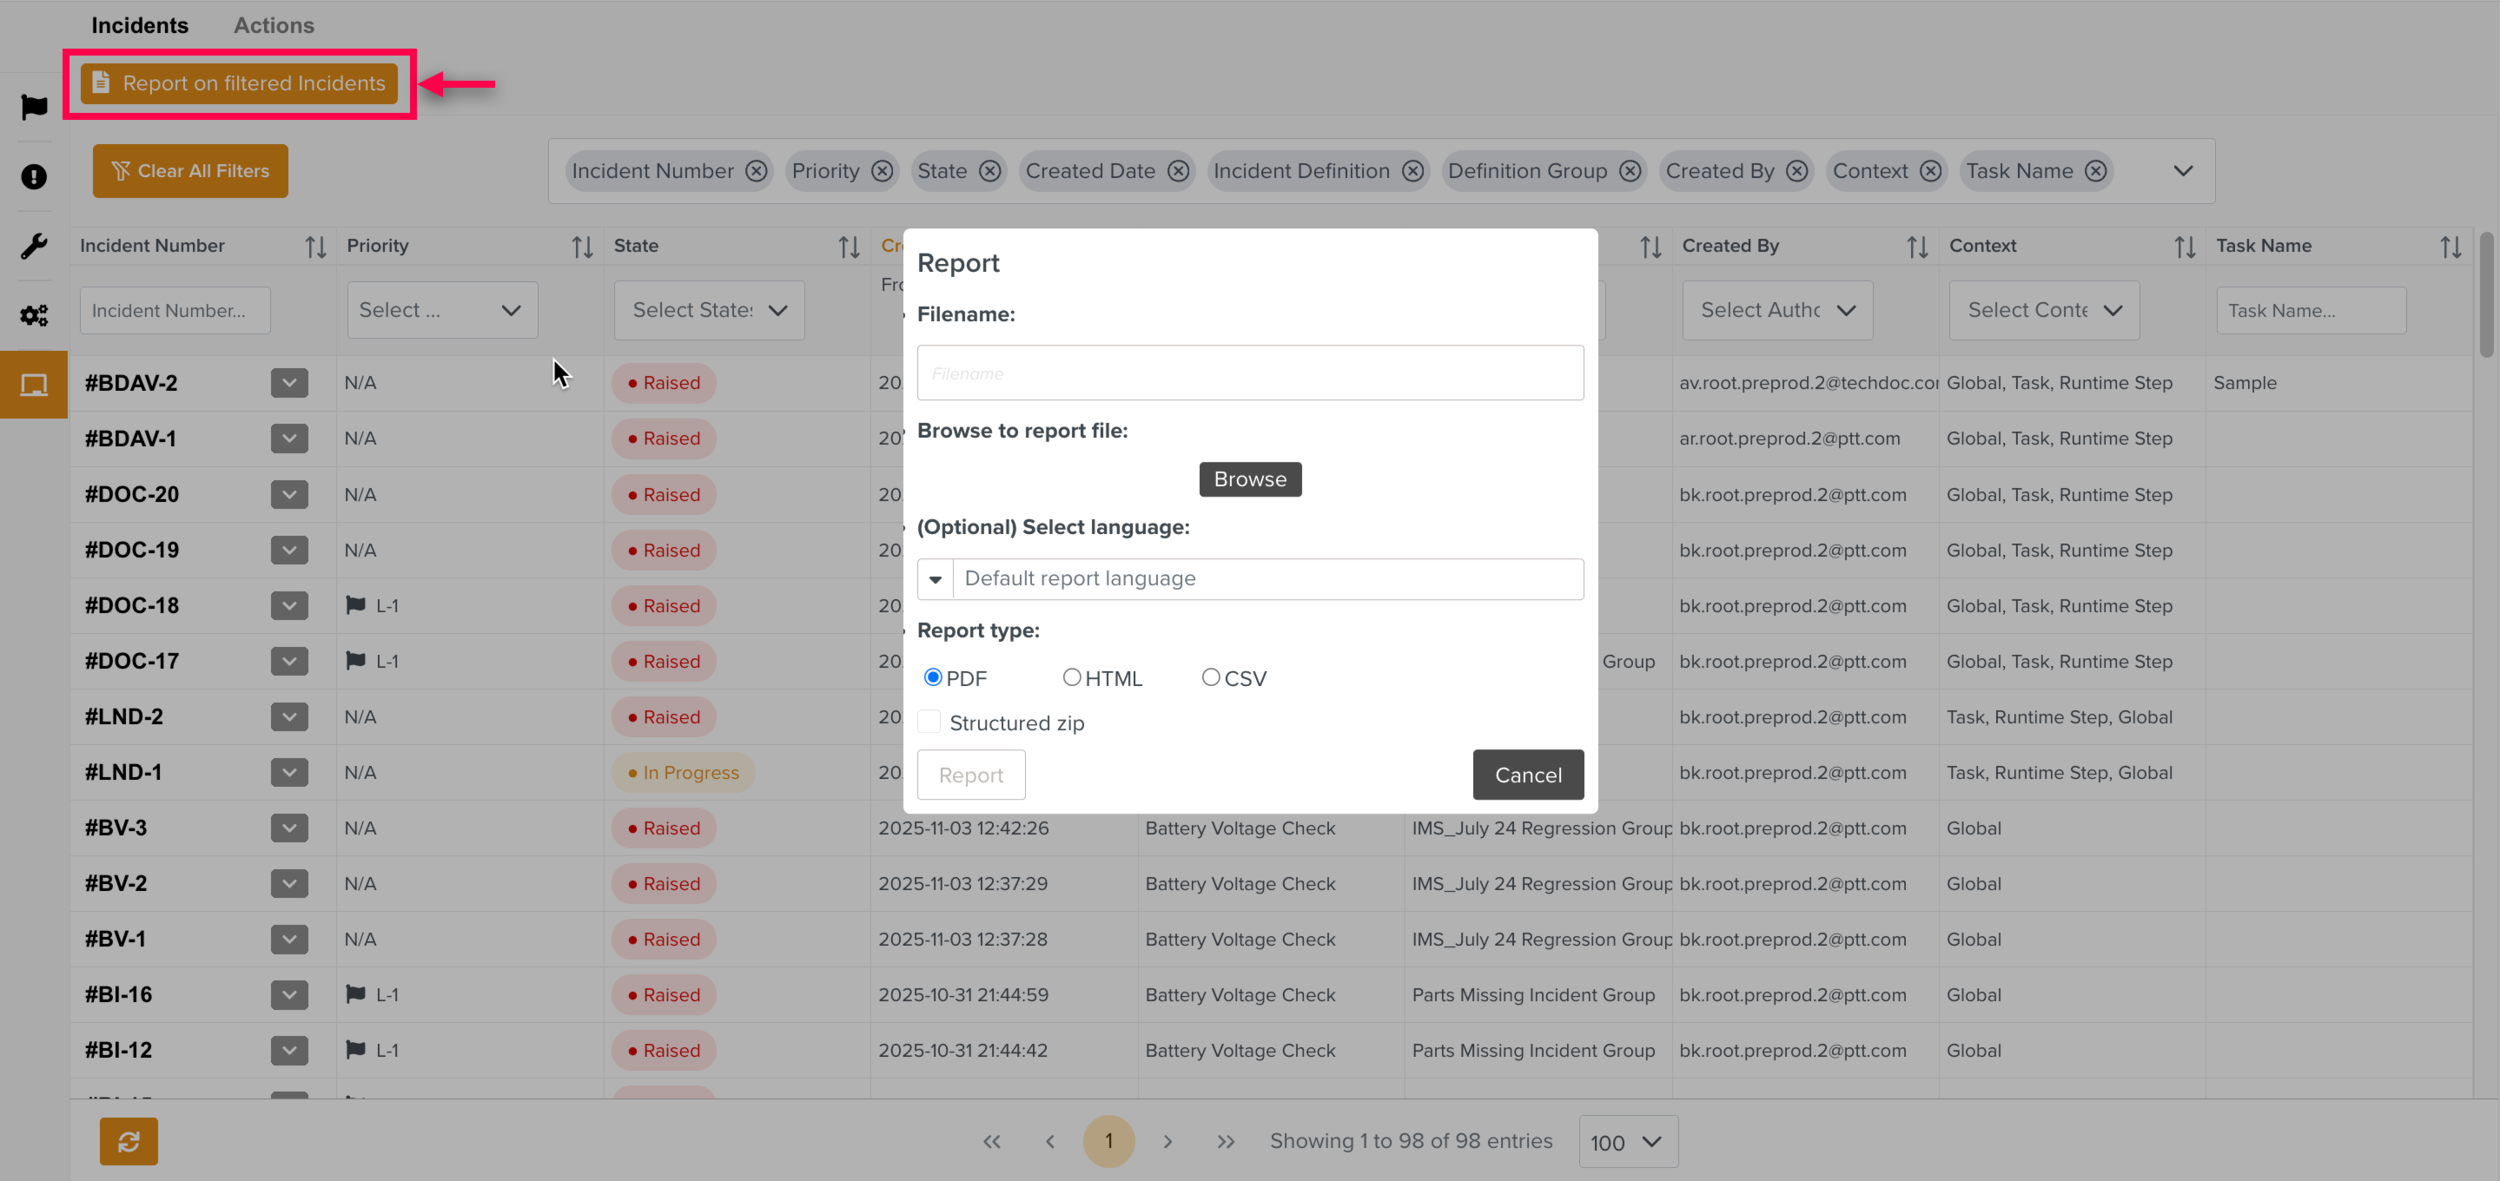
To generate reports on the filtered Incidents, click Report on filtered Incidents.
 |
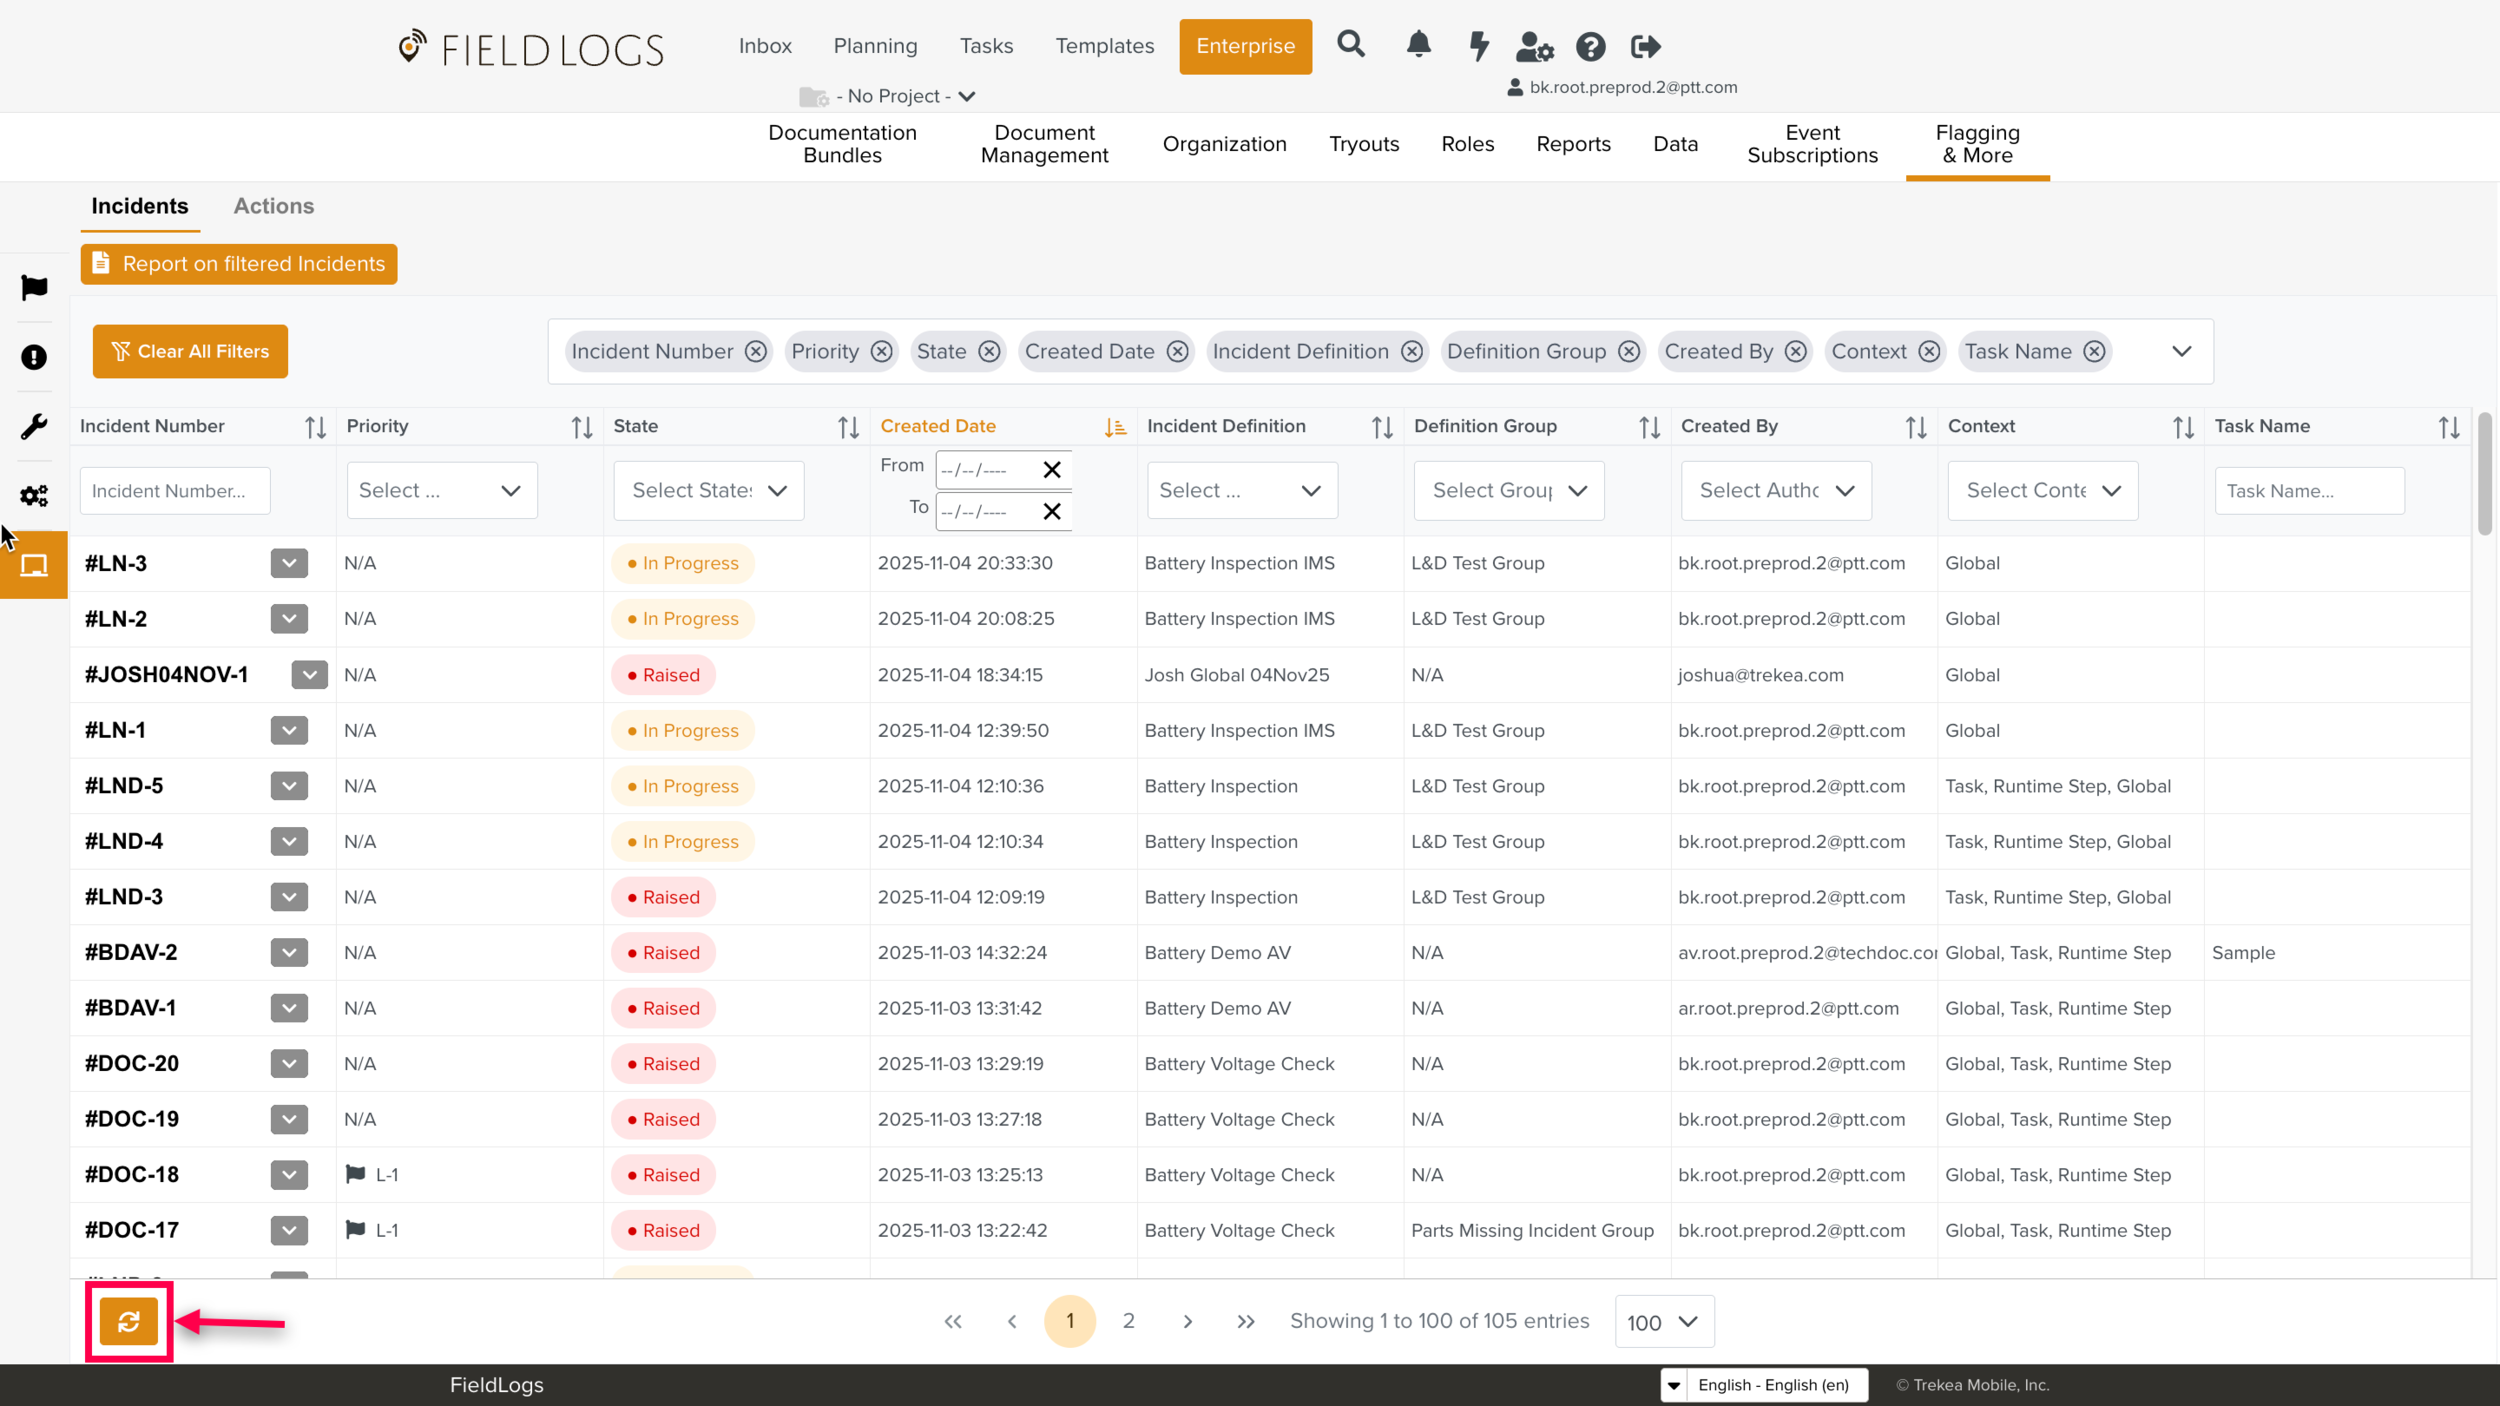
You can refresh the entire Incident Dashboard using  icon.
icon.
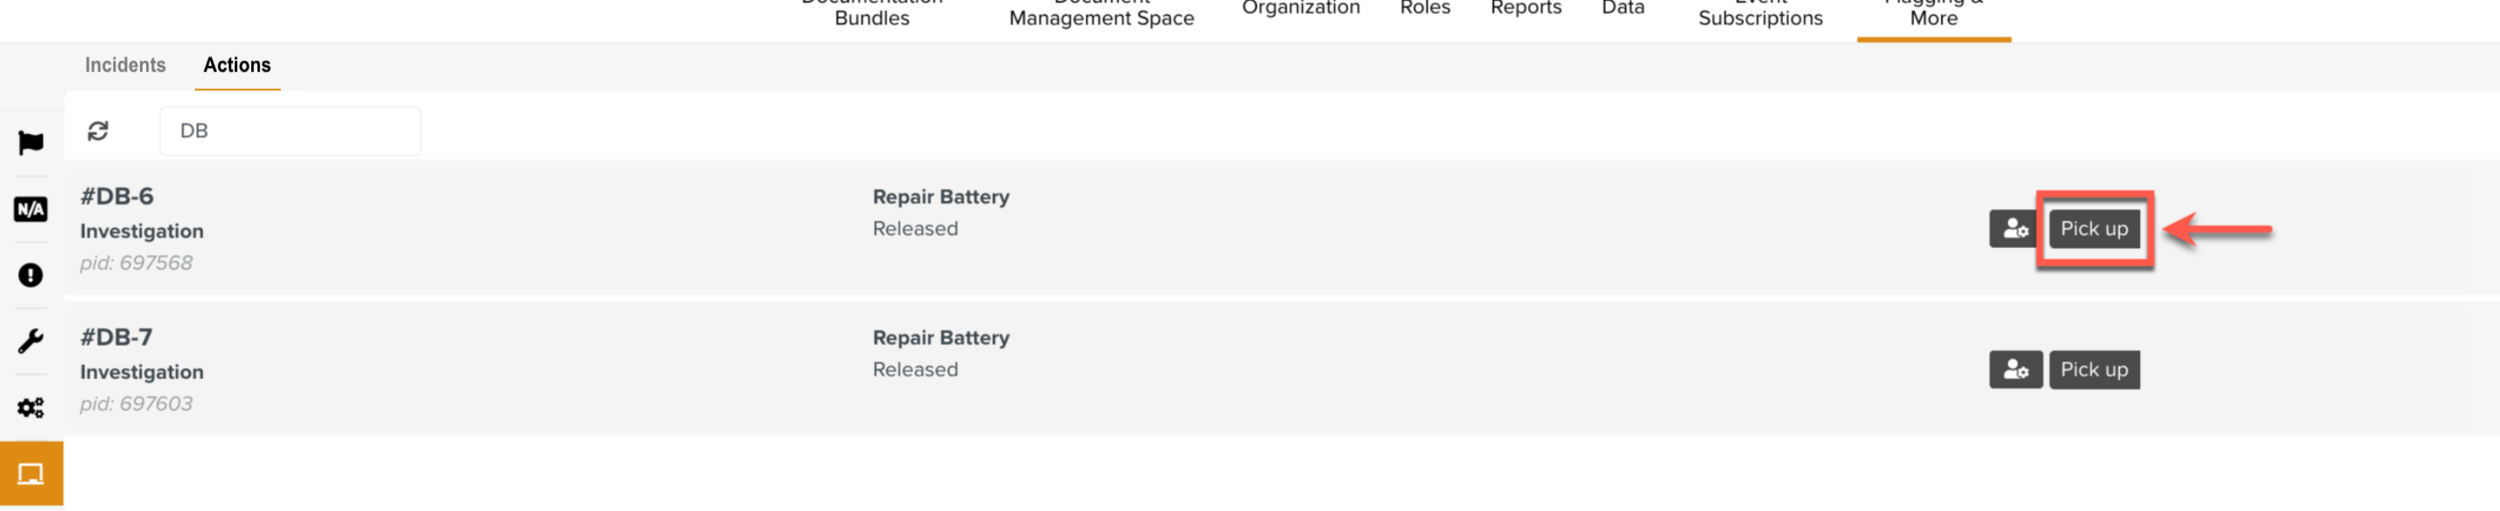
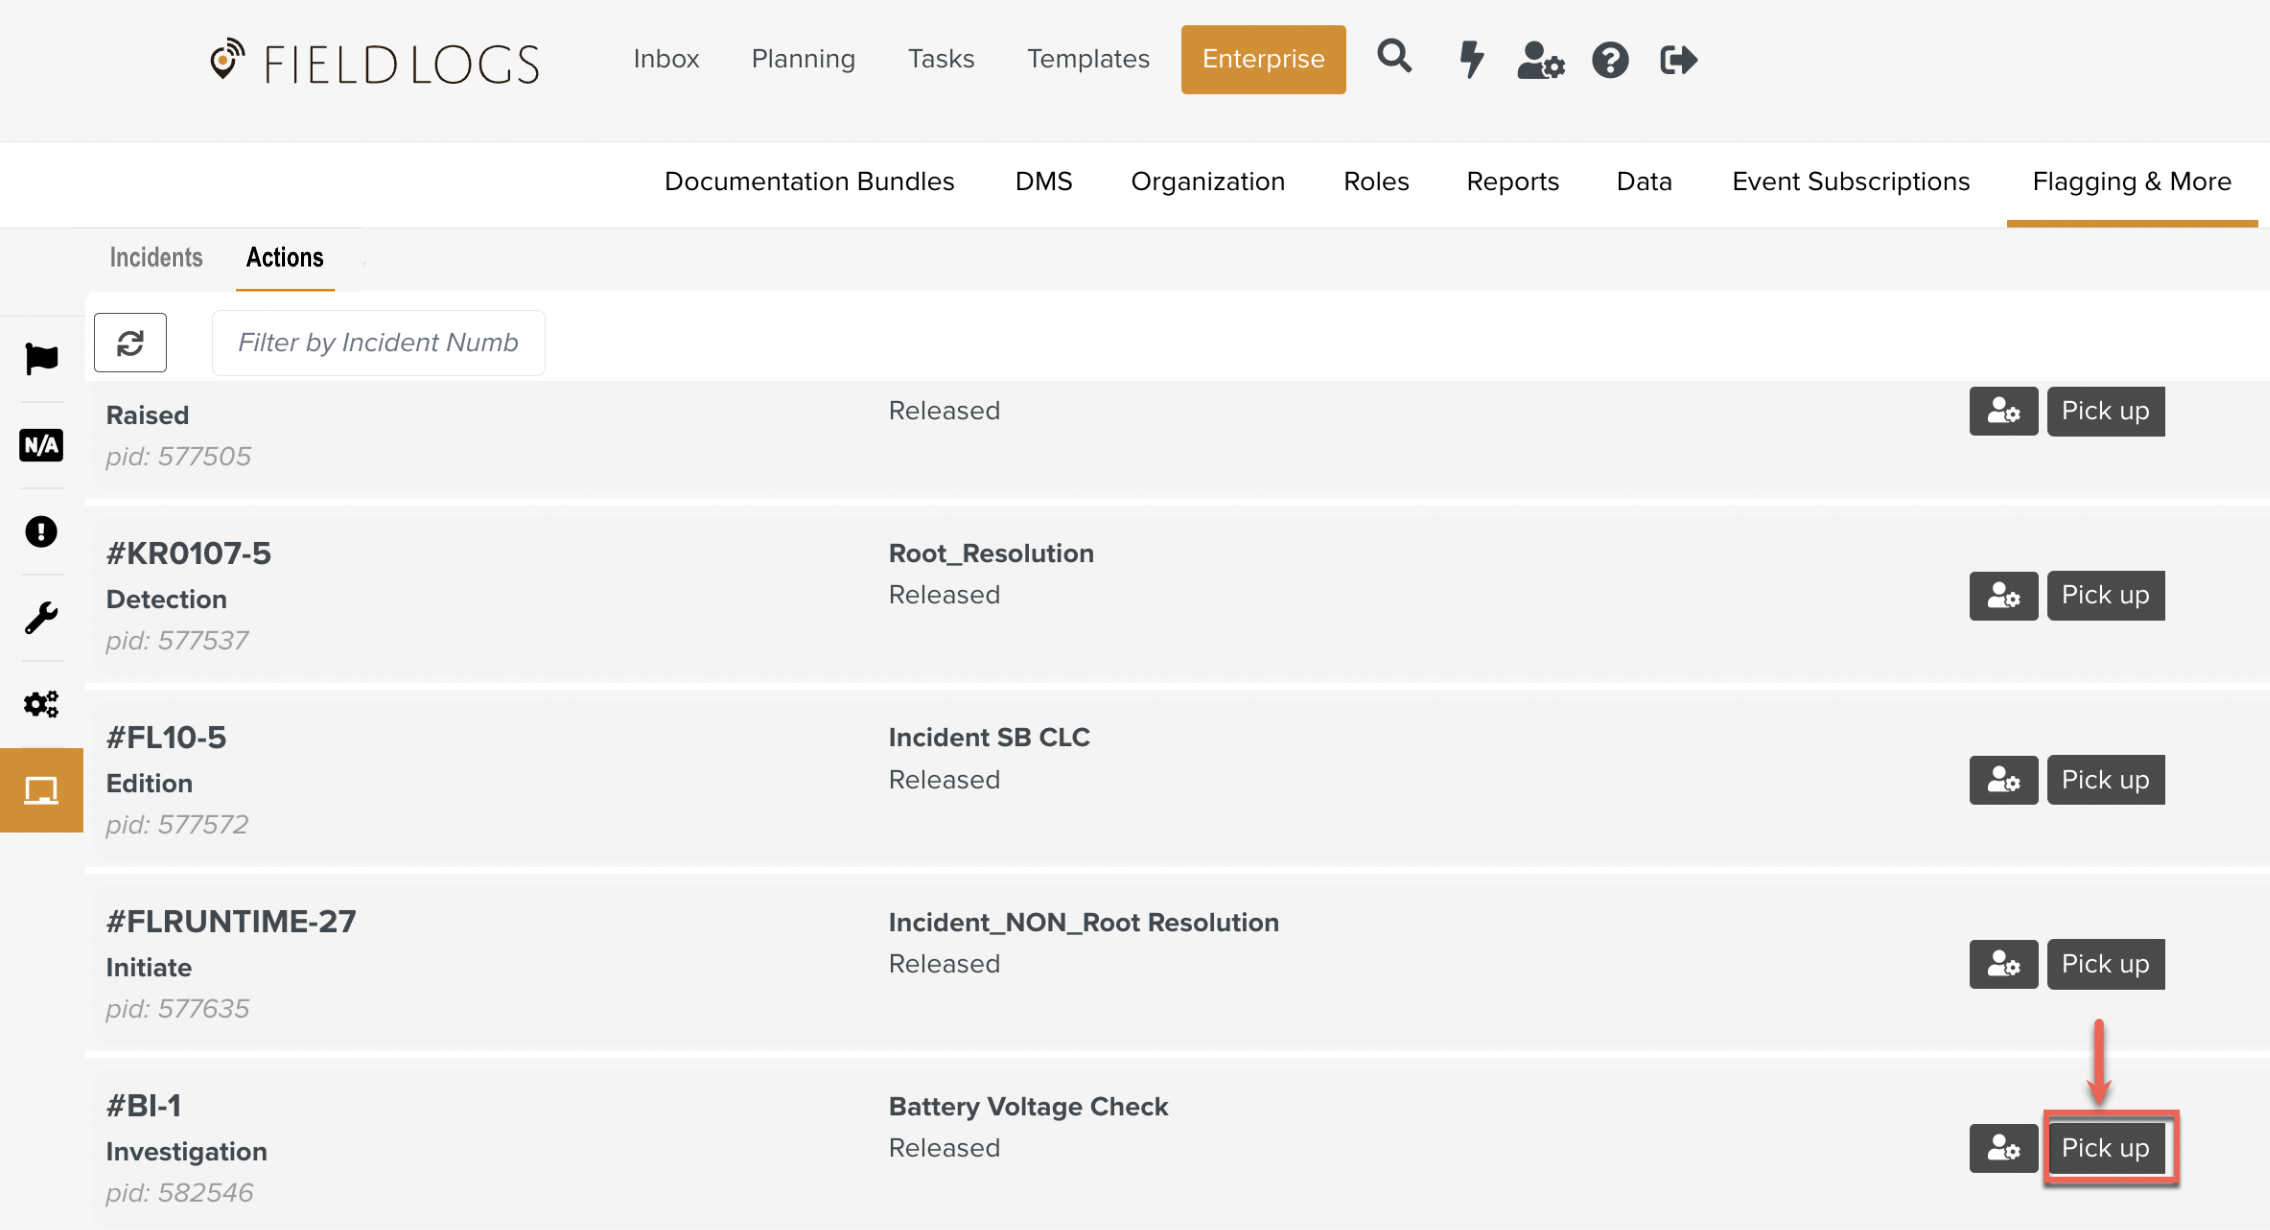
You can resolve an Incident from the Actions tab.
In the example below, Task #LND-1 is picked up.
 |
The Resolution Flow for this Incident is Battery Voltage Check. When the Action is picked up, the username, date, and time of pickup are displayed.
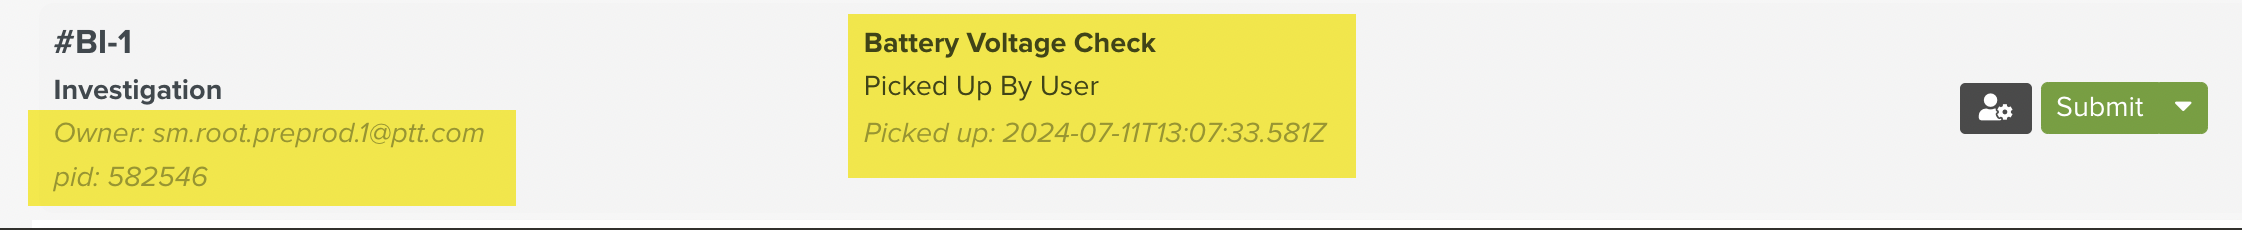 |
On every step of the Resolution Flow, the Actions tab displays the username, date, and time.
The actions configured on the Resolution Flow are available as User Actions. In the example below, there are four actions available to the user at every step.
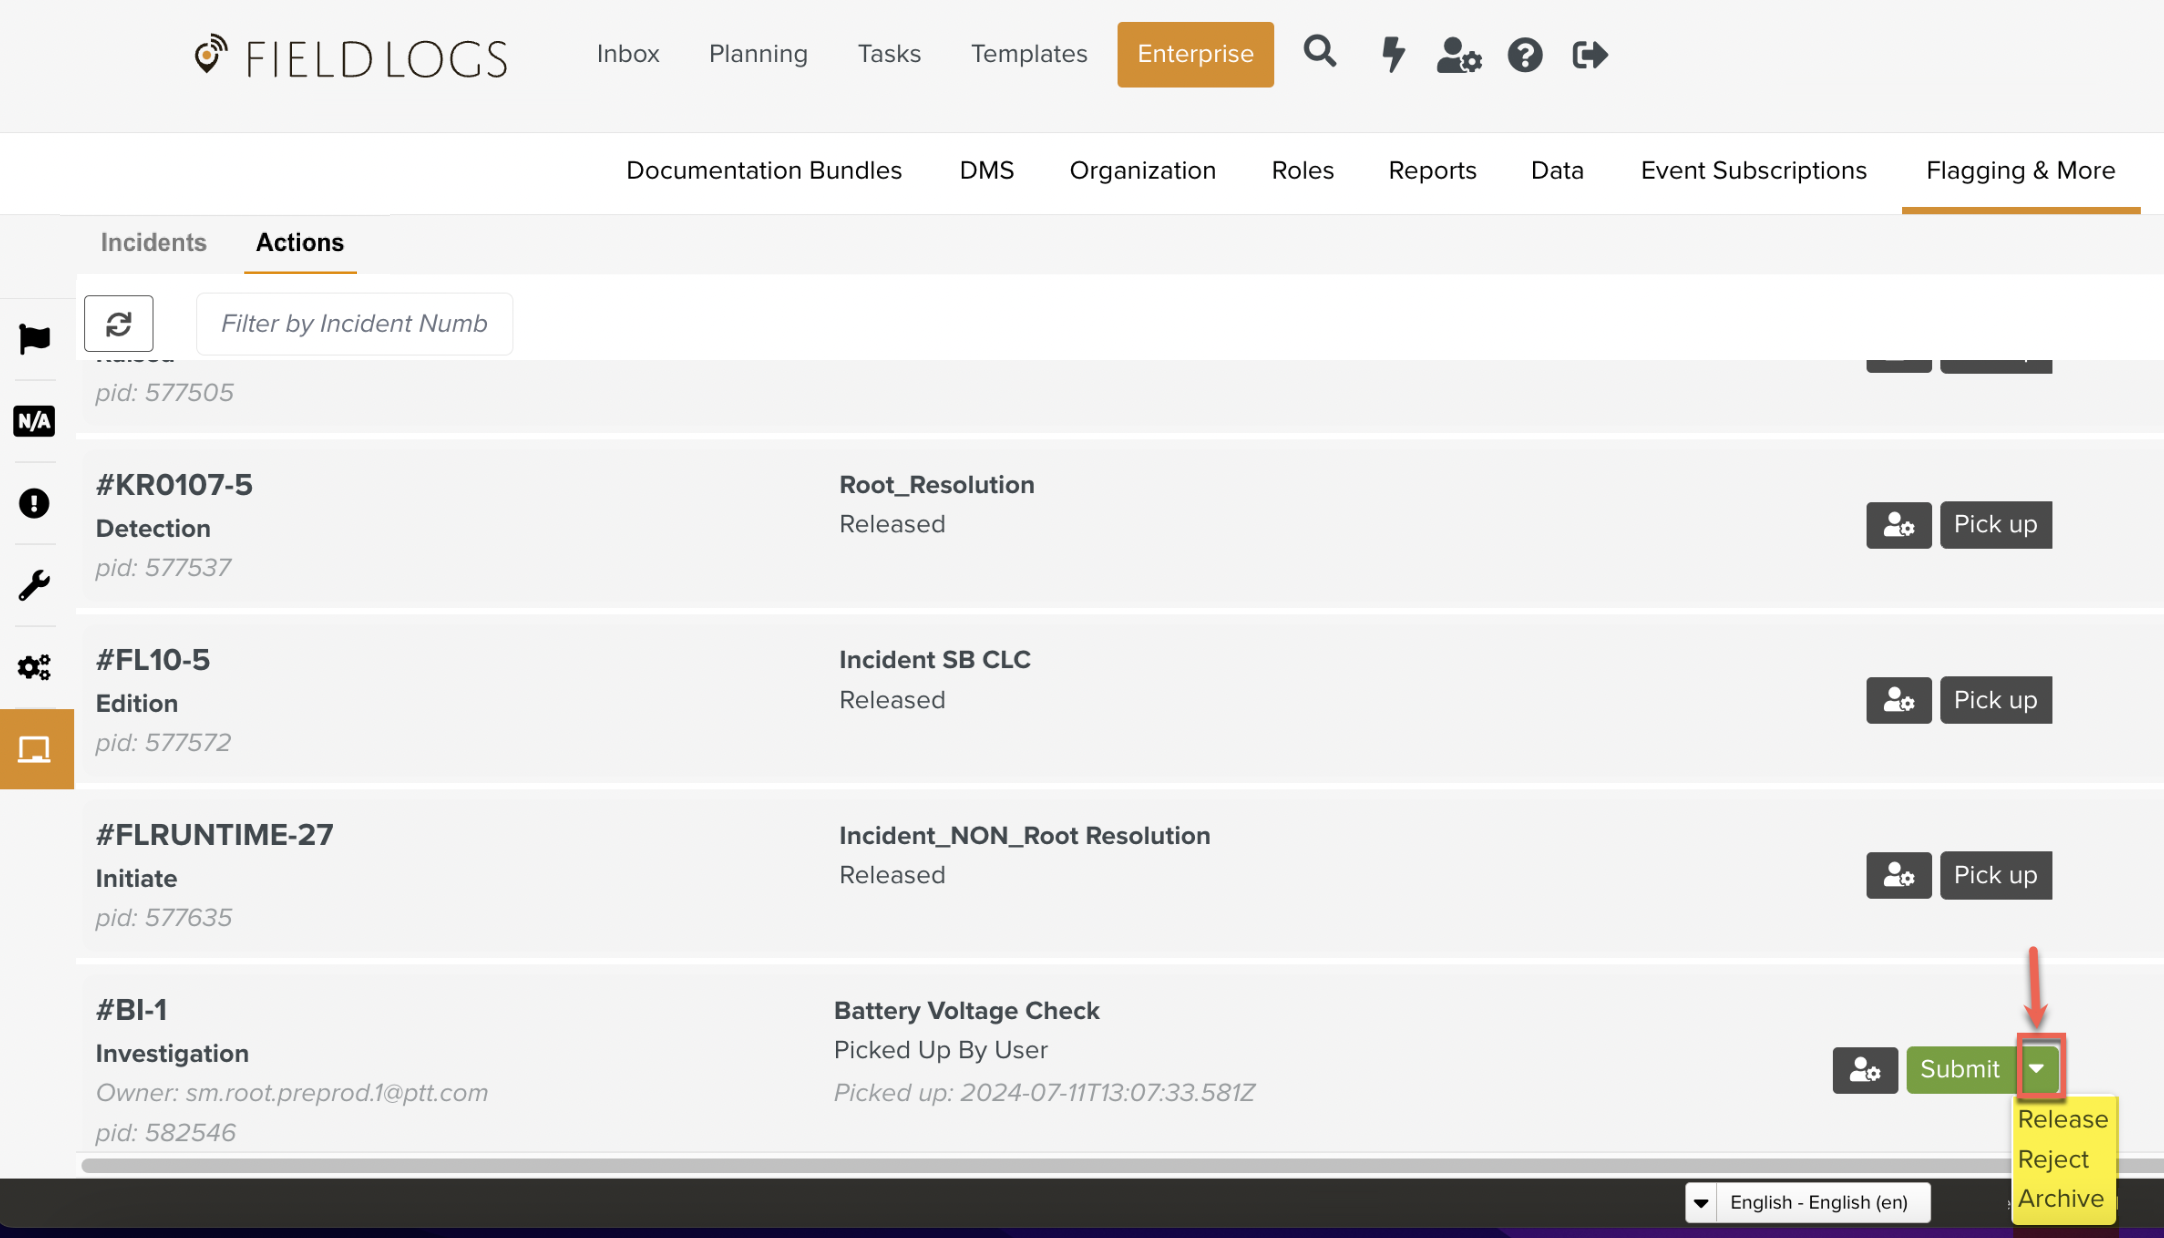 |
1. Submit: The Incident moves to the next step in the Resolution Flow.
2. Release: The Incident is released from the current user. Another user can pick it up.
3. Reject: The current action is rejected. This moves the Incident to the previous step of the Resolution Flow.
4. Archive: The Incident is archived.
Sorting and filtering of Incidents
You can filter Incidents using the following criteria:
1. Incident Number
2. Incident Definition
3. Priority
4. Author
You can sort Incidents based on the following criteria:
1. Incident Number (alphabetical order A-Z or Z-A)
2. Created Date (Newest first or Oldest First)
3. Incident Definition Name (alphabetical order A-Z or Z-A)
4. Priority Name (Newest first or Oldest First)
 |
You can refresh the page by clicking 
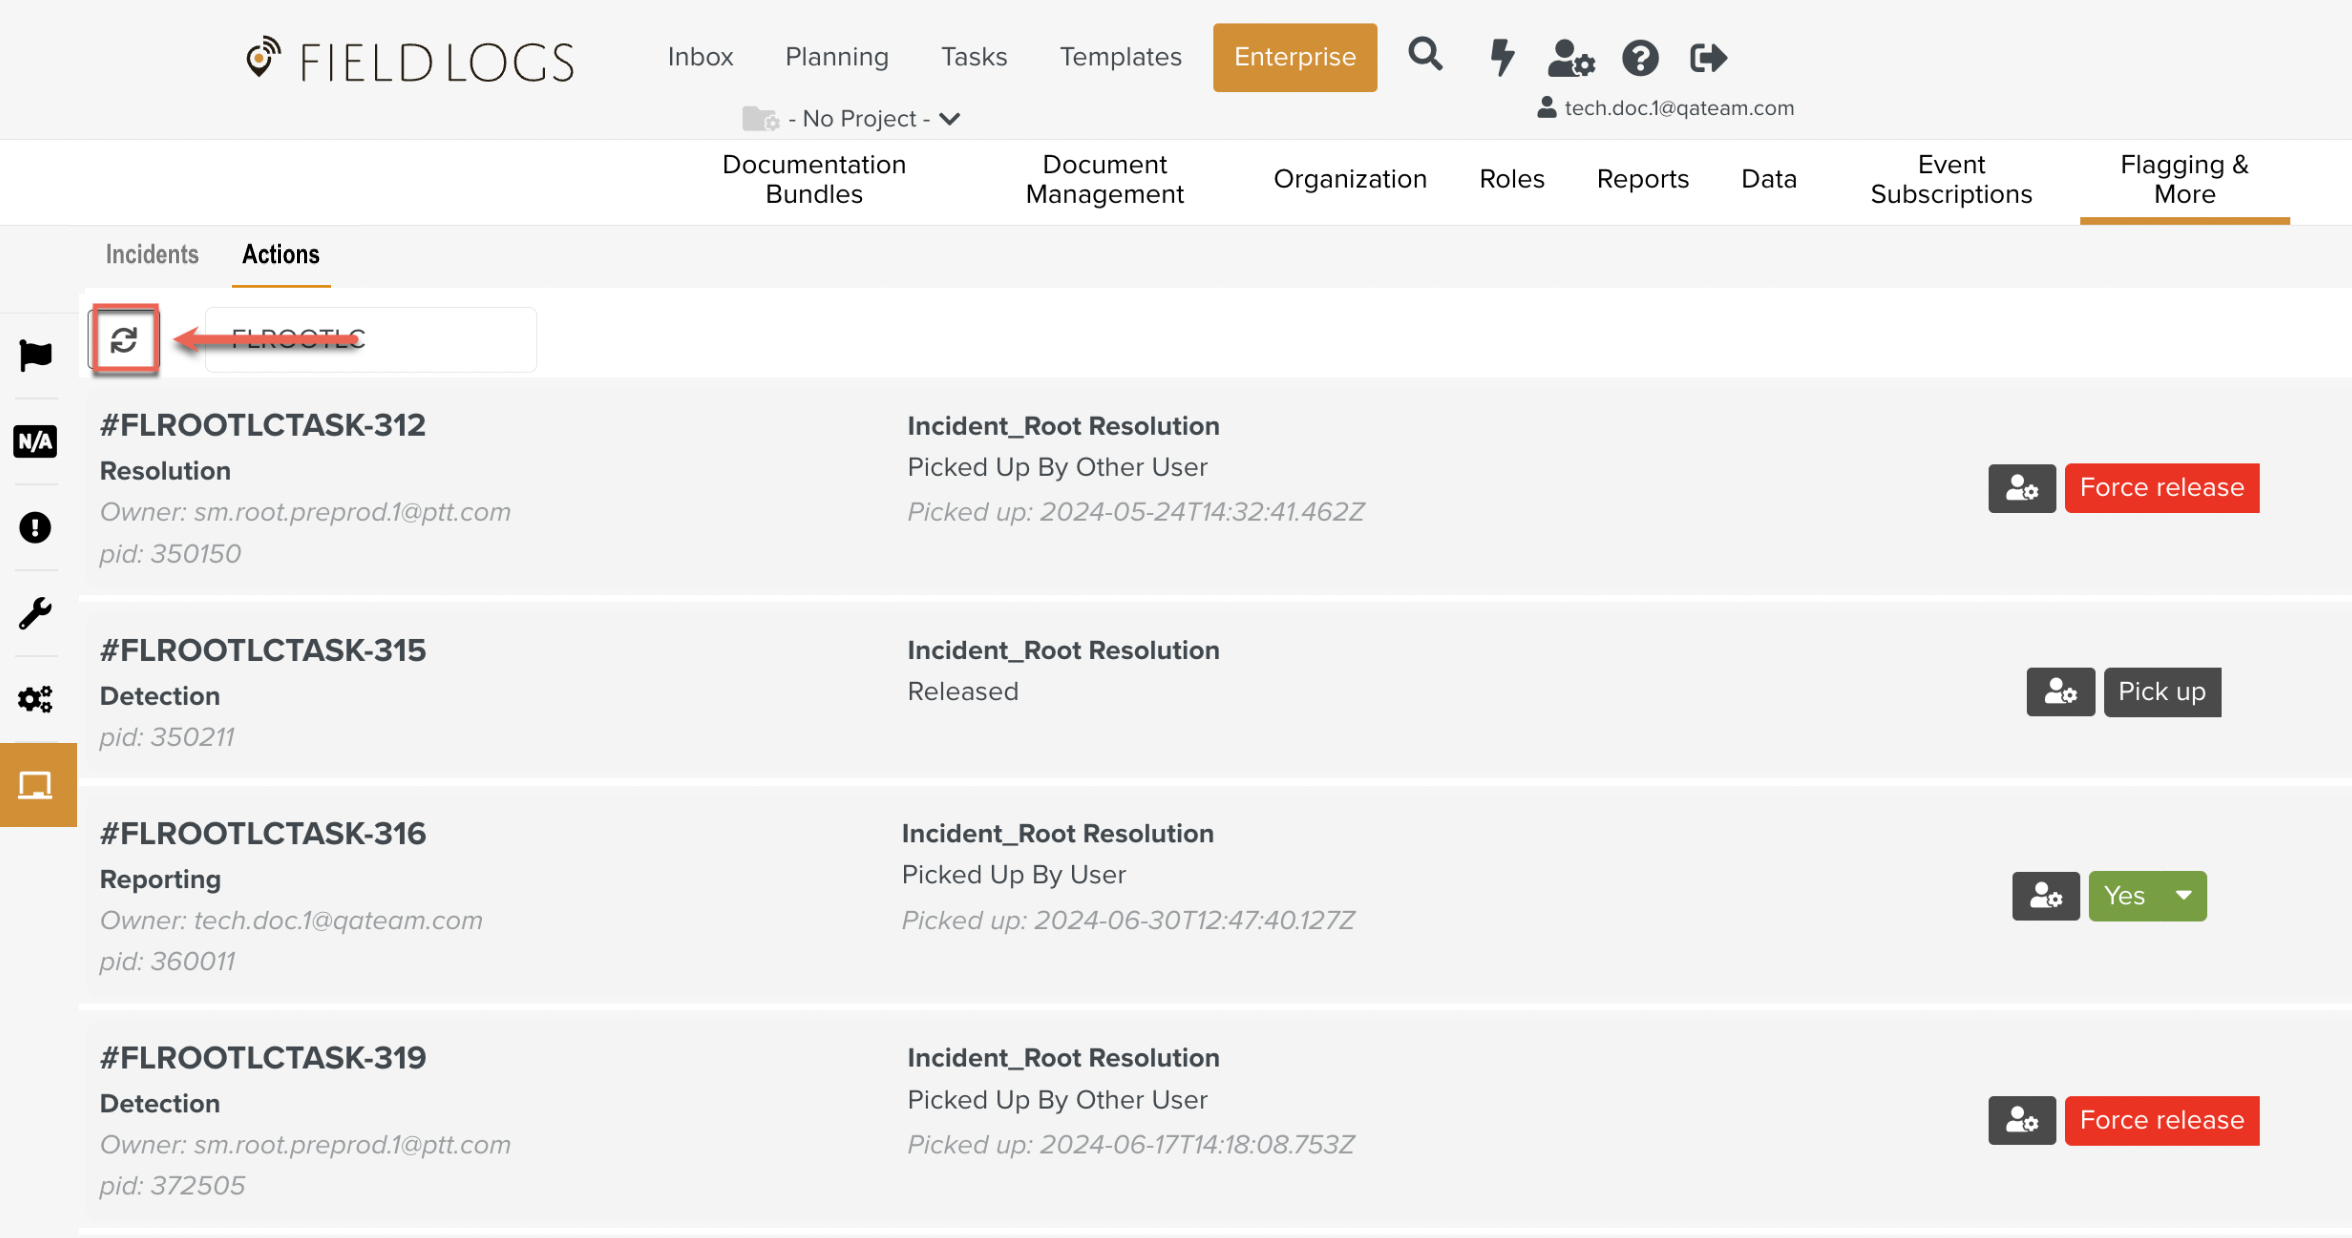 |
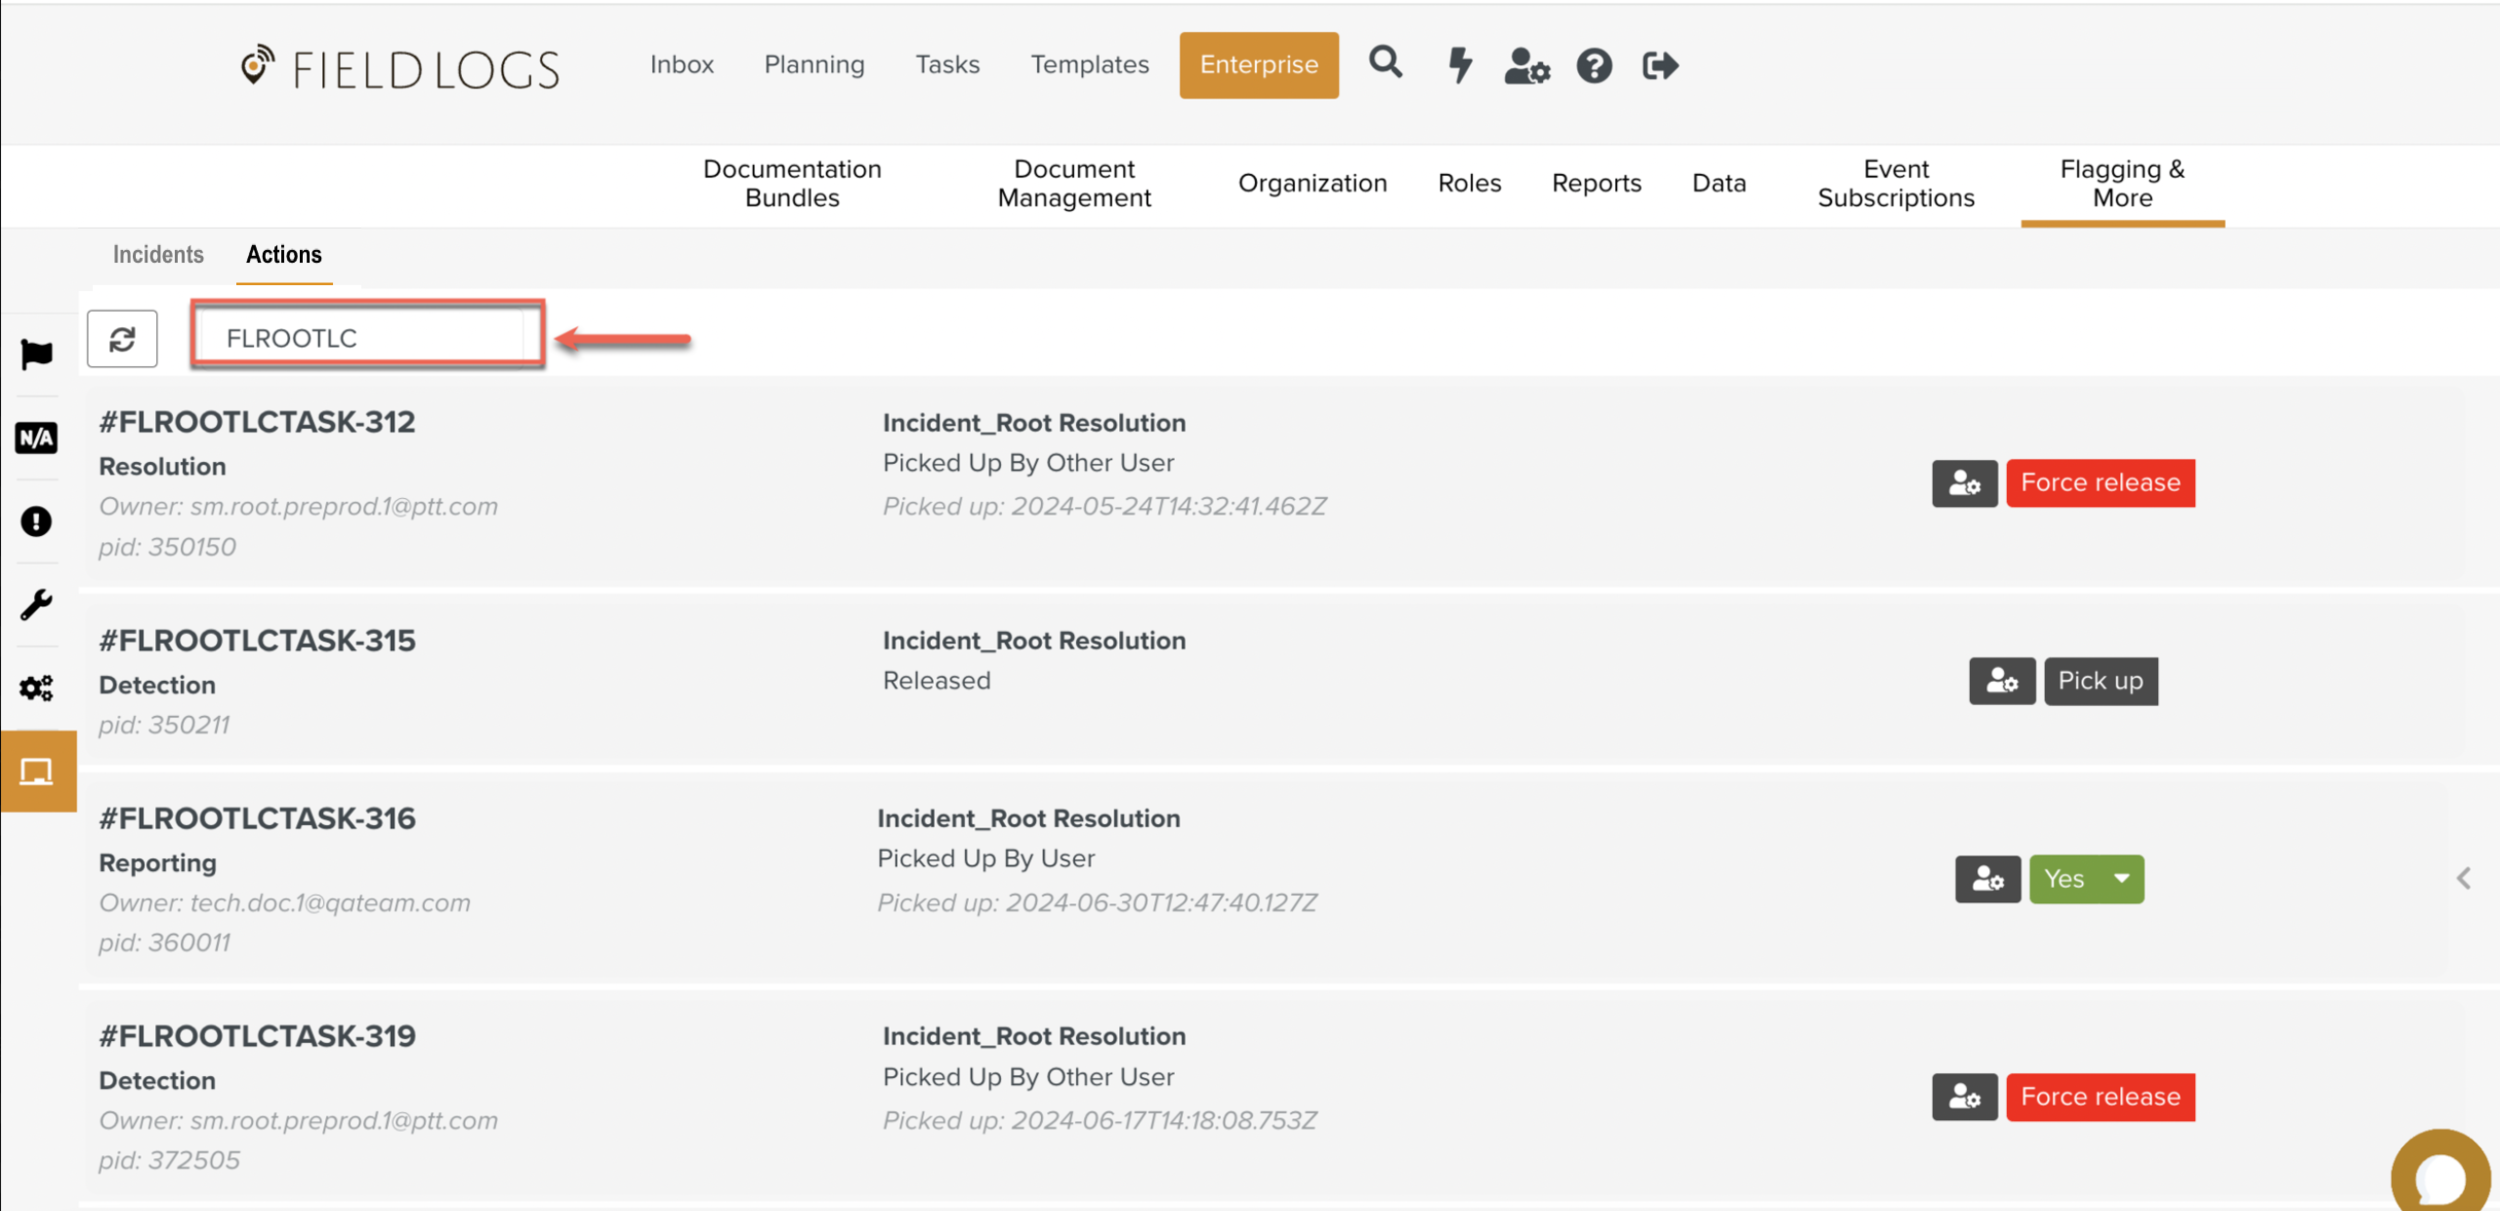
When another user picks up the Incident, the option is available.
This releases the Incident from the current user. Other users can then pick up the Incident.
 |